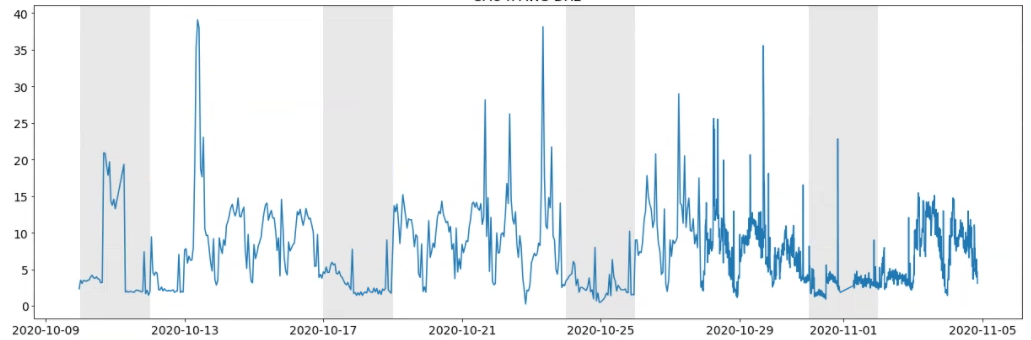
def plot(df,  desc):
    fig, ax = plt.subplots(figsize=(17,6))
    weekend_indices = df['ds'].apply(lambda x: x.weekday() >= 5)
    wk = weekend_indices[weekend_indices == True]
    ax.plot(df['ds'].values, df['y'])
    for k,v in wk.iteritems():
        ax.axvspan(df['ds'].iloc[k],
                   df['ds'].iloc[k+1],
                   facecolor='#d9d9d9',
                   edgecolor='none',
                   alpha=.6)
    plt.title(desc, fontsize=16)
    plt.xticks(fontsize=14)
    plt.yticks(fontsize=14)
    fig.tight_layout()
    plt.show()
    plt.pause(0.01)