- Functionality needed in LogQL to parse dates
- https://github.com/grafana/loki/issues/3535
- can’t get timestamp from JSON log with promtail
- https://github.com/grafana/loki/issues/3694
Bash
https://grafana.com/docs/loki/latest/api/#examples-4
curl -v -H "Content-Type: application/json" \
        -XPOST -s "http://localhost:3100/loki/api/v1/push" \
        --data-raw \
  '{"streams": [{ "stream": { "foo": "bar2" }, "values": [ [ "1570818238000000000", "fizzbuzz" ] ] }]}'
Stdin
https://grafana.com/docs/loki/latest/clients/promtail/troubleshooting/
cat my.log | promtail --stdin --client.url http://127.0.0.1:3100/loki/api/v1/push
cat my.log | promtail --stdin  \
                      --client.url http://127.0.0.1:3100/loki/api/v1/push \
                      --client.external-labels=k1=v1,k2=v2
ssh <host> "tail -n0 -F <file> " | \
.promtail --stdin  \
          --client.url http://127.0.0.1:3100/loki/api/v1/push \
          --client.external-labels=k1=v1,k2=v2
Pipelines
https://grafana.com/docs/loki/latest/clients/promtail/pipelines/
  - match:
      selector: '{name="promtail"}'
      stages:
      # The regex stage parses out a level, timestamp, and component. At the end
      # of the stage, the values for level, timestamp, and component are only
      # set internally for the pipeline. Future stages can use these values and
      # decide what to do with them.
      - regex:
          expression: '.*level=(?P<level>[a-zA-Z]+).*ts=(?P<timestamp>[T\d-:.Z]*).*component=(?P<component>[a-zA-Z]+)'

      # The labels stage takes the level and component entries from the previous
      # regex stage and promotes them to a label. For example, level=error may
      # be a label added by this stage.
      - labels:
          level:
          component:

      # Finally, the timestamp stage takes the timestamp extracted from the
      # regex stage and promotes it to be the new timestamp of the log entry,
      # parsing it as an RFC3339Nano-formatted value.
      - timestamp:
          format: RFC3339Nano
          source: timestamp
then setting the matching time format as described here https://grafana.com/docs/loki/latest/clients/promtail/stages/timestamp/
ANSIC: Mon Jan _2 15:04:05 2006
UnixDate: Mon Jan _2 15:04:05 MST 2006
RubyDate: Mon Jan 02 15:04:05 -0700 2006
RFC822: 02 Jan 06 15:04 MST
RFC822Z: 02 Jan 06 15:04 -0700
RFC850: Monday, 02-Jan-06 15:04:05 MST
RFC1123: Mon, 02 Jan 2006 15:04:05 MST
RFC1123Z: Mon, 02 Jan 2006 15:04:05 -0700
RFC3339: 2006-01-02T15:04:05-07:00
RFC3339Nano: 2006-01-02T15:04:05.999999999-07:00
https://github.com/grafana/loki/issues/1334
https://github.com/grafana/grafana/issues/20511
clients:
- url: http://localhost:3100/loki/api/v1/push
positions:
filename: /tmp/20511-positions.yml
scrape_configs:
- job_name: testing
static_configs:
- targets:
- localhost
labels:
__path__: /tmp/random.log
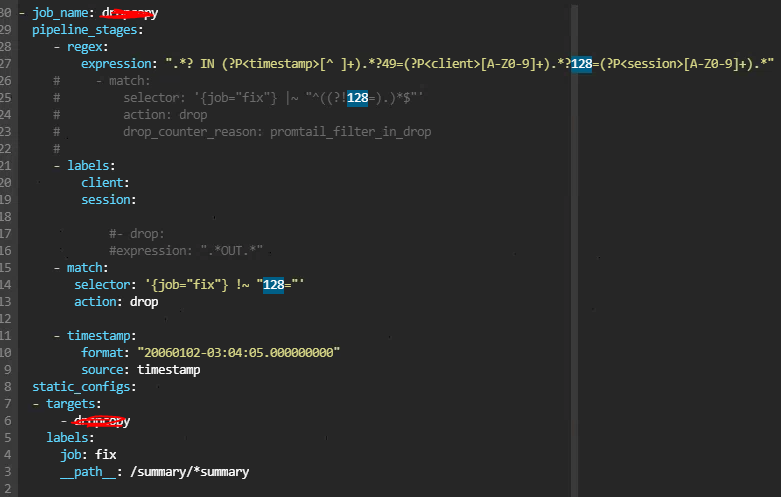
pipeline_stages:
- json:
expressions:
message:
timestamp:
- timestamp:
source: timestamp
format: 2006-01-02T15:04:05.000000Z
- output:
source: message
Drop capability in stages https://grafana.com/docs/loki/latest/clients/promtail/stages/match/ from https://github.com/grafana/loki/issues/553
pipeline_stages:
- json:
    expressions:
      app:
- labels:
    app:
- match:
    selector: '{app="loki"}'
    stages:
    - json:
        expressions:
          msg: message
- match:
    pipeline_name: "app2"
    selector: '{app="pokey"}'
    action: keep
    stages:
    - json:
        expressions:
          msg: msg
- match:
    selector: '{app="promtail"} |~ ".*noisy error.*"'
    action: drop
    drop_counter_reason: promtail_noisy_error
- output:
    source: msg
Caveats
Unknown error during query transaction. Please check JS console logs. #1164
loki engine is timing out
https://github.com/grafana/loki/issues/1164
grafana.ini
[dataproxy]
timeout = 600
loki-config.yaml
server:
  http_listen_port: 3100
  grpc_listen_port: 9096
  http_server_read_timeout: 10m
  http_server_write_timeout: 10m

querier:
  query_timeout: 10m
  engine:
    timeout: 10m