Inspired by the video below
- https://netflixtechblog.com/vizceral-open-source-acc0c32113fe
- https://github.com/Netflix/vizceral
- vizceral: The main UI component that lets you view and interact with the graph data.
- https://github.com/Netflix/vizceral-react
- vizceral-react: A react component wrapper around vizceral to make it easier to integrate the visualization into a react project.
- https://github.com/Netflix/vizceral-component
- vizceral-component: A web component wrapper around vizceral to make it easier to integrate the visualization into a project using web components.
- https://github.com/Netflix/vizceral-example
- vizceral-example: An example project that uses vizceral-react and sample data as a proof of concept and a jumping off point for integrating the visualization into your own data sources.
- https://github.com/Netflix/vizceral

node_modules/vizceral/src/base/shapes/ShapeAzure.js

https://github.com/Netflix/vizceral/wiki/How-to-Use
https://github.com/Netflix/Vizceral/wiki/Configuration#filters
{
detailedNode: { // These definitions are for switching what the detailed node shows
volume: { // `volume` (default mode) is already defined internally, but can be customized by passing it in again with different configuration parameters
default: { // default is required
// top metric in the detailed node. set to null if you want it to be blank
// `header` is the text header to be displayed
// `data` is the path to the data to display on the node object
// `format` is how to format the data using numeral.js
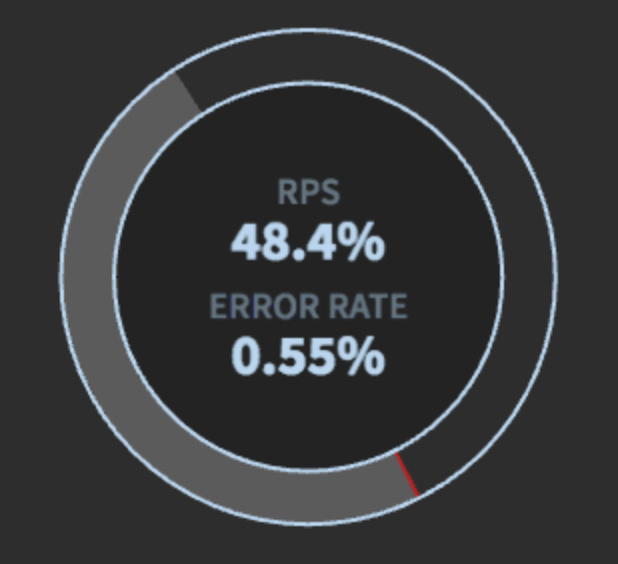
top: { header: '% RPS', data: 'data.volumePercent', format: '0.00%' },
// bottom metric in the detailed node. set to null if you want it to blank
// `header` is the text header to be displayed
// `data` is the path to the data to display on the node object
// `format` is how to format the data using numeral.js
bottom: { header: 'ERROR RATE', data: 'data.classPercents.danger', format: '0.00%' },
donut: {} // What fills the donut graph around the detailed node, check the donut graph header for more information
arc: {} // What fills the arc meter inside the detailed node; if absent, no arc meter will be drawn
},
region: { // override for the region renderer
top: { header: 'SERVICE RPS', data: 'data.volume', format: '0.0' }
},
entry: { // override for entry nodes
top: { header: 'TOTAL RPS', data: 'data.volume', format: '0.0' }
}
}
}
}
node size & position
https://github.com/Netflix/vizceral/issues/70


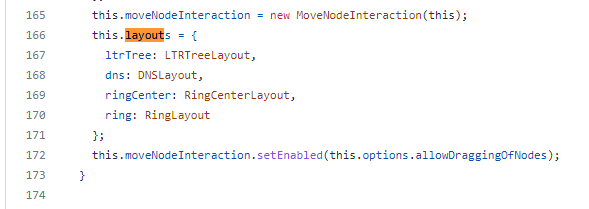
layouts
vizceral/src/vizceral.js