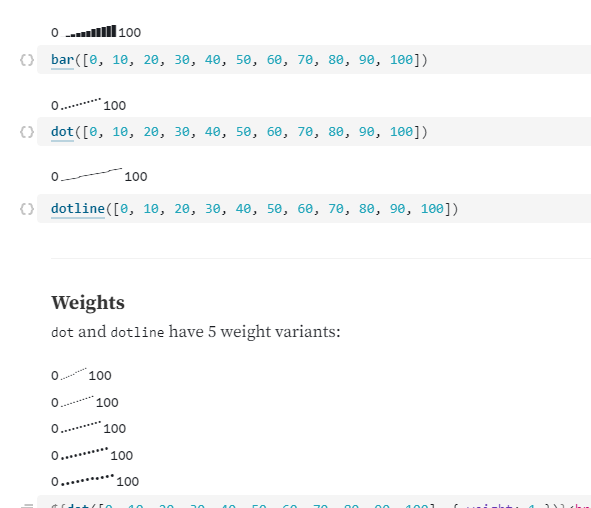
sparks
https://observablehq.com/@mjbo/sparks
create sparklines d3js
https://www.essycode.com/posts/create-sparkline-charts-d3/

import {
  range       as d3_range,
  select      as d3_select,
  scaleLinear as d3_scaleLinear
} from 'd3';
const WIDTH      = 160;
const HEIGHT     = 30;
const DATA_COUNT = 40;
const BAR_WIDTH  = (WIDTH - DATA_COUNT) / DATA_COUNT;
const data = d3_range(DATA_COUNT).map( d => Math.random() );
const x    = d3_scaleLinear().domain([0, DATA_COUNT]).range([0, WIDTH]);
const y    = d3_scaleLinear().domain([0, 1]).range([HEIGHT, 0]);
const svg = d3_select('#sparklines').append('svg')
  .attr('width', WIDTH)
  .attr('height', HEIGHT)
  .append('g');
svg.selectAll('.bar').data(data)
  .enter()
  .append('rect')
    .attr('class', 'bar')
    .attr('x', (d, i) => x(i))
    .attr('y', d => HEIGHT - y(d))
    .attr('width', BAR_WIDTH)
    .attr('height', d => y(d))
    .attr('fill', 'MediumSeaGreen');

import {
  range       as d3_range,
  select      as d3_select,
  scaleLinear as d3_scaleLinear
} from 'd3';
const WIDTH      = 200;
const HEIGHT     = 30;
const DATA_MAX   = 50;
const DATA_MIN   = -50;
const DATA_COUNT = 40;
const BAR_WIDTH  = (WIDTH - DATA_COUNT) / DATA_COUNT;
const data = d3_range(DATA_COUNT).map( d => DATA_MIN + (DATA_MAX - DATA_MIN) * Math.random() );
const x    = d3_scaleLinear().domain([0, DATA_COUNT]).range([0, WIDTH]);
const y    = d3_scaleLinear().domain([DATA_MIN, DATA_MAX]).range([HEIGHT, 0]);
const svg = d3_select('#sparklines').append('svg')
  .attr('width', WIDTH)
  .attr('height', HEIGHT)
  .append('g');
svg.selectAll('.bar').data(data)
  .enter()
  .append('rect')
    .attr('class', 'bar')
    .attr('x', (d, i) => x(i))
    .attr('y', d => d > 0 ? y(d) : y(0))
    .attr('width', BAR_WIDTH)
    .attr('height', d => Math.abs(y(d) - y(0)))
    .attr('fill', d => d > 0 ? 'steelblue' : 'tomato');

import {
  line        as d3_line,
  range       as d3_range,
  select      as d3_select,
  scaleLinear as d3_scaleLinear
} from 'd3';
const WIDTH        = 200;
const HEIGHT       = 30;
const MARGIN       = { top: 5, right: 5, bottom: 5, left: 5 };
const INNER_WIDTH  = WIDTH - MARGIN.left - MARGIN.right;
const INNER_HEIGHT = HEIGHT - MARGIN.top - MARGIN.bottom;
const DATA_COUNT   = 40;
const data = d3_range(DATA_COUNT).map( d => Math.random() );
const x    = d3_scaleLinear().domain([0, DATA_COUNT]).range([0, INNER_WIDTH]);
const y    = d3_scaleLinear().domain([0, 1]).range([INNER_HEIGHT, 0]);
const svg = d3_select('#sparklines').append('svg')
  .attr('width', WIDTH)
  .attr('height', HEIGHT)
  .append('g')
    .attr('transform', 'translate(' + MARGIN.left + ',' + MARGIN.top + ')');
const line = d3_line()
  .x((d, i) => x(i))
  .y(d => y(d));
svg.append('path').datum(data)
  .attr('fill', 'none')
  .attr('stroke', '#bbb')
  .attr('stroke-width', 1)
  .attr('d', line);
svg.append('circle')
  .attr('r', 2)
  .attr('cx', x(0))
  .attr('cy', y(data[0]))
  .attr('fill', 'steelblue');
svg.append('circle')
  .attr('r', 2)
  .attr('cx', x(DATA_COUNT - 1))
  .attr('cy', y(data[DATA_COUNT - 1]))
  .attr('fill', 'tomato');
tiny charts
https://observablehq.com/@hamzaamjad/tiny-charts

Building an Interactive Sparkline Graph with D3
https://tympanus.net/codrops/2022/03/29/building-an-interactive-sparkline-graph-with-d3/

Sparklines in d3js
https://jarrettmeyer.com/2018/07/17/sparklines-in-d3
const sparkline = (container, data, options) => {
    const defaults = {
        scale: {
            x: d3.scaleLinear(),
            y: d3.scaleLinear()
        },
        size: [100, 40],
        style: {
            stroke: "rgb(60, 120, 240)",
            strokeWidth: 1
        },
        value: {
            x: d => d[0],
            y: d => d[1]
        }
    };

    // Apply defaults to the given options.
    options = $.extend(true, defaults, options);

    // Add an SVG object to the given container.
    let svg = d3
        .select(container)
        .append("svg")
        .classed("sparkline", true)
        .classed("sparkline-svg", true)
        .attr("width", options.size[0])
        .attr("height", options.size[1]);

    let g = svg
        .append("g")
        .classed("sparkline", true)
        .classed("sparkline-group", true);

    let xScale = options.scale.x.range([0, options.size[0]]).domain(d3.extent(data, options.value.x));

    let yScale = options.scale.y.range([options.size[1], 0]).domain(d3.extent(data, options.value.y));

    // Create the line generator function.
    let line = d3
        .line()
        .x(d => xScale(options.value.x(d)))
        .y(d => yScale(options.value.y(d)));

    // Finally, draw the path object.
    let path = g
        .append("path")
        .classed("sparkline", true)
        .classed("sparkline-path", true)
        .datum(data)
        .attr("d", line)
        .style("fill", "none")
        .style("stroke", options.style.stroke)
        .style("stroke-width", options.style.strokeWidth);

    return path;
};