Prologue
https://wentzwu.com/2020/08/24/microservices-containerization-and-serverless/
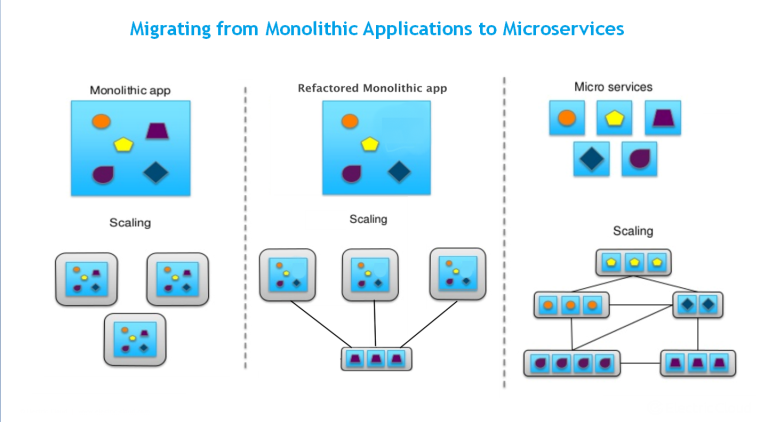
https://www.akana.com/resources/microservices-why-should-businesses-care


Concept
https://passionateaboutoss.com/getting-confused-by-key-assurance-metrics/

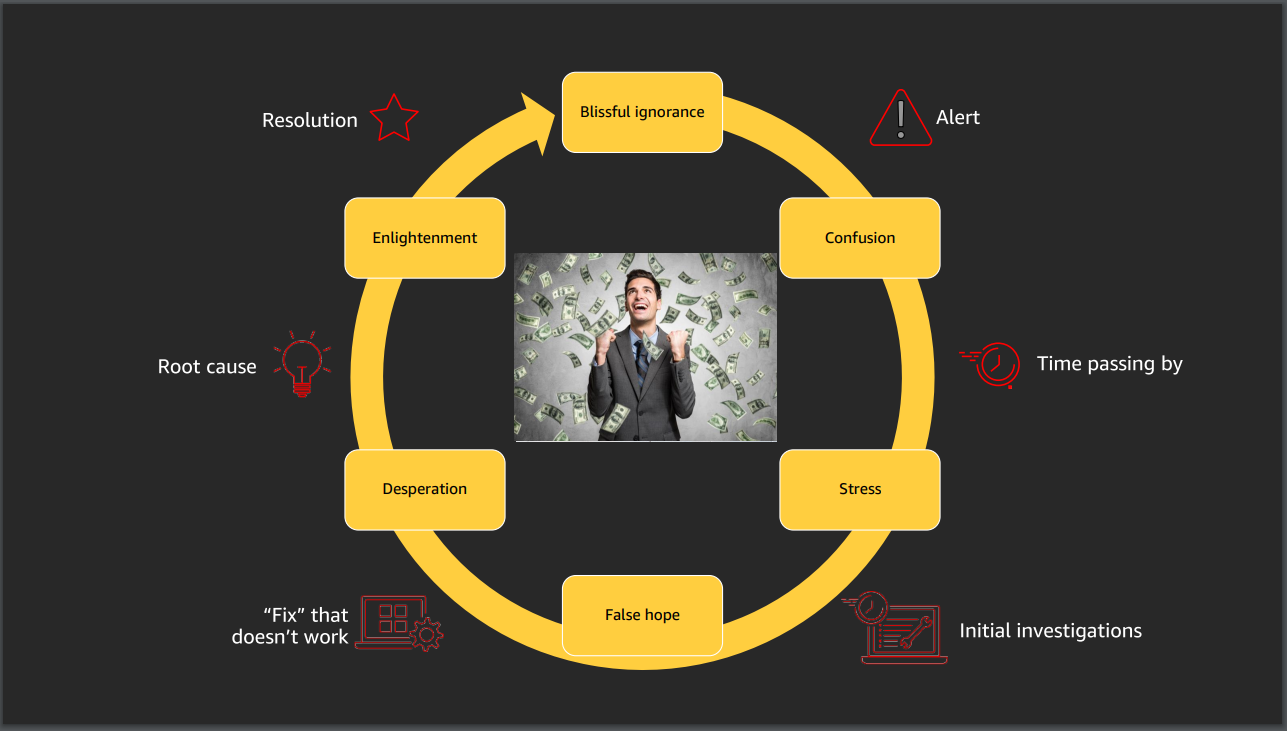
- MTBF (Mean Time Between Failures) – the average elapsed time between failures of a system, service or device. It’s the basic measure of availability / reliability of the system / service / device. The higher, the better.
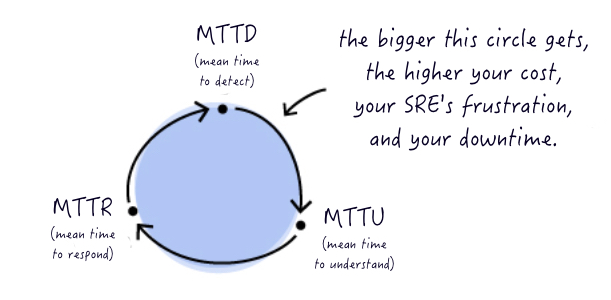
- MTTR (Mean Time to Repair) – generally used to denote the average time to close a trouble ticket (to repair a failed system / service / device). It’s the basic measure of corrective action efficiency. The lower, the better.
Some also use MTTR as a Mean Time to Recover / Resolve (ie MTTD + MTTR in the diagram above) or Mean Time to Respond (MTTD in the diagram above to acknowledge an event and create a ticket). See why I get confused?
-
MTTD (Mean Time to Detect / Diagnose) – the average time taken from when an event is first generated and timestamped to when the NOC detects / diagnoses the cause and generates a ticket. The lower, the better.
-
MTTF (Mean Time to Failure) – the average system / service / device up-time
https://www.atlassian.com/incident-management/kpis/common-metrics
- MTTR (mean time to respond) is the average time it takes to recover from a product or system failure from the time when you are first alerted to that failure.
- MTTA (mean time to acknowledge) is the average time it takes from when an alert is triggered to when work begins on the issue.
https://www.guyfighel.com/blog/tag/SRE
AWS re:Invent 2019: Cut through the chaos: Gain operational visibility and insight (MGT301-R1)
file.pdf
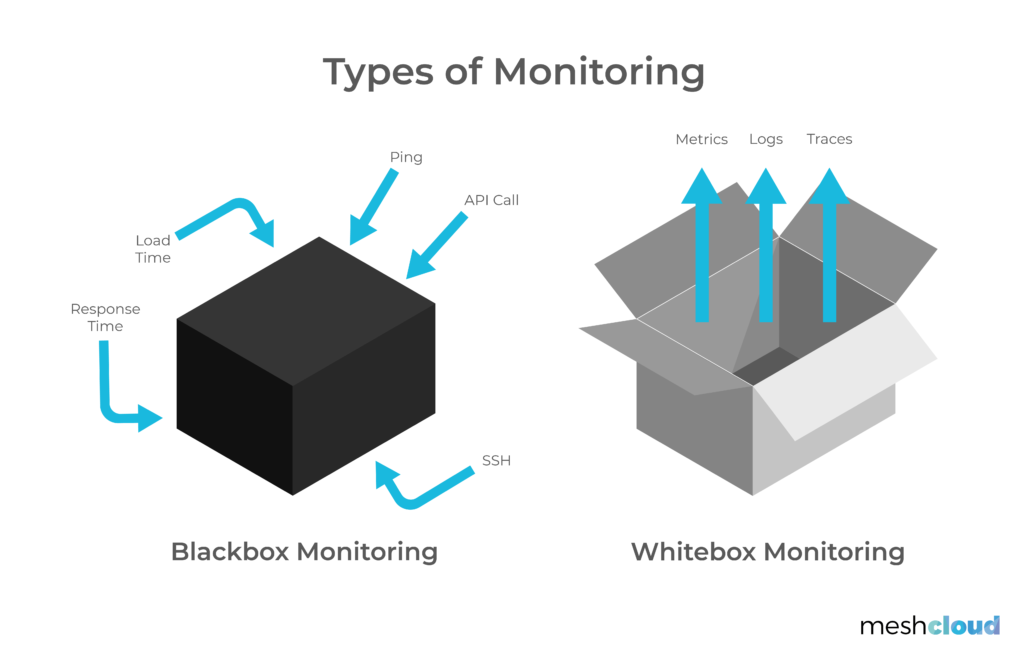
types of monitoring blackbox vs whitebox
https://www.meshcloud.io/2020/08/28/multi-cloud-monitoring-a-cloud-security-essential/
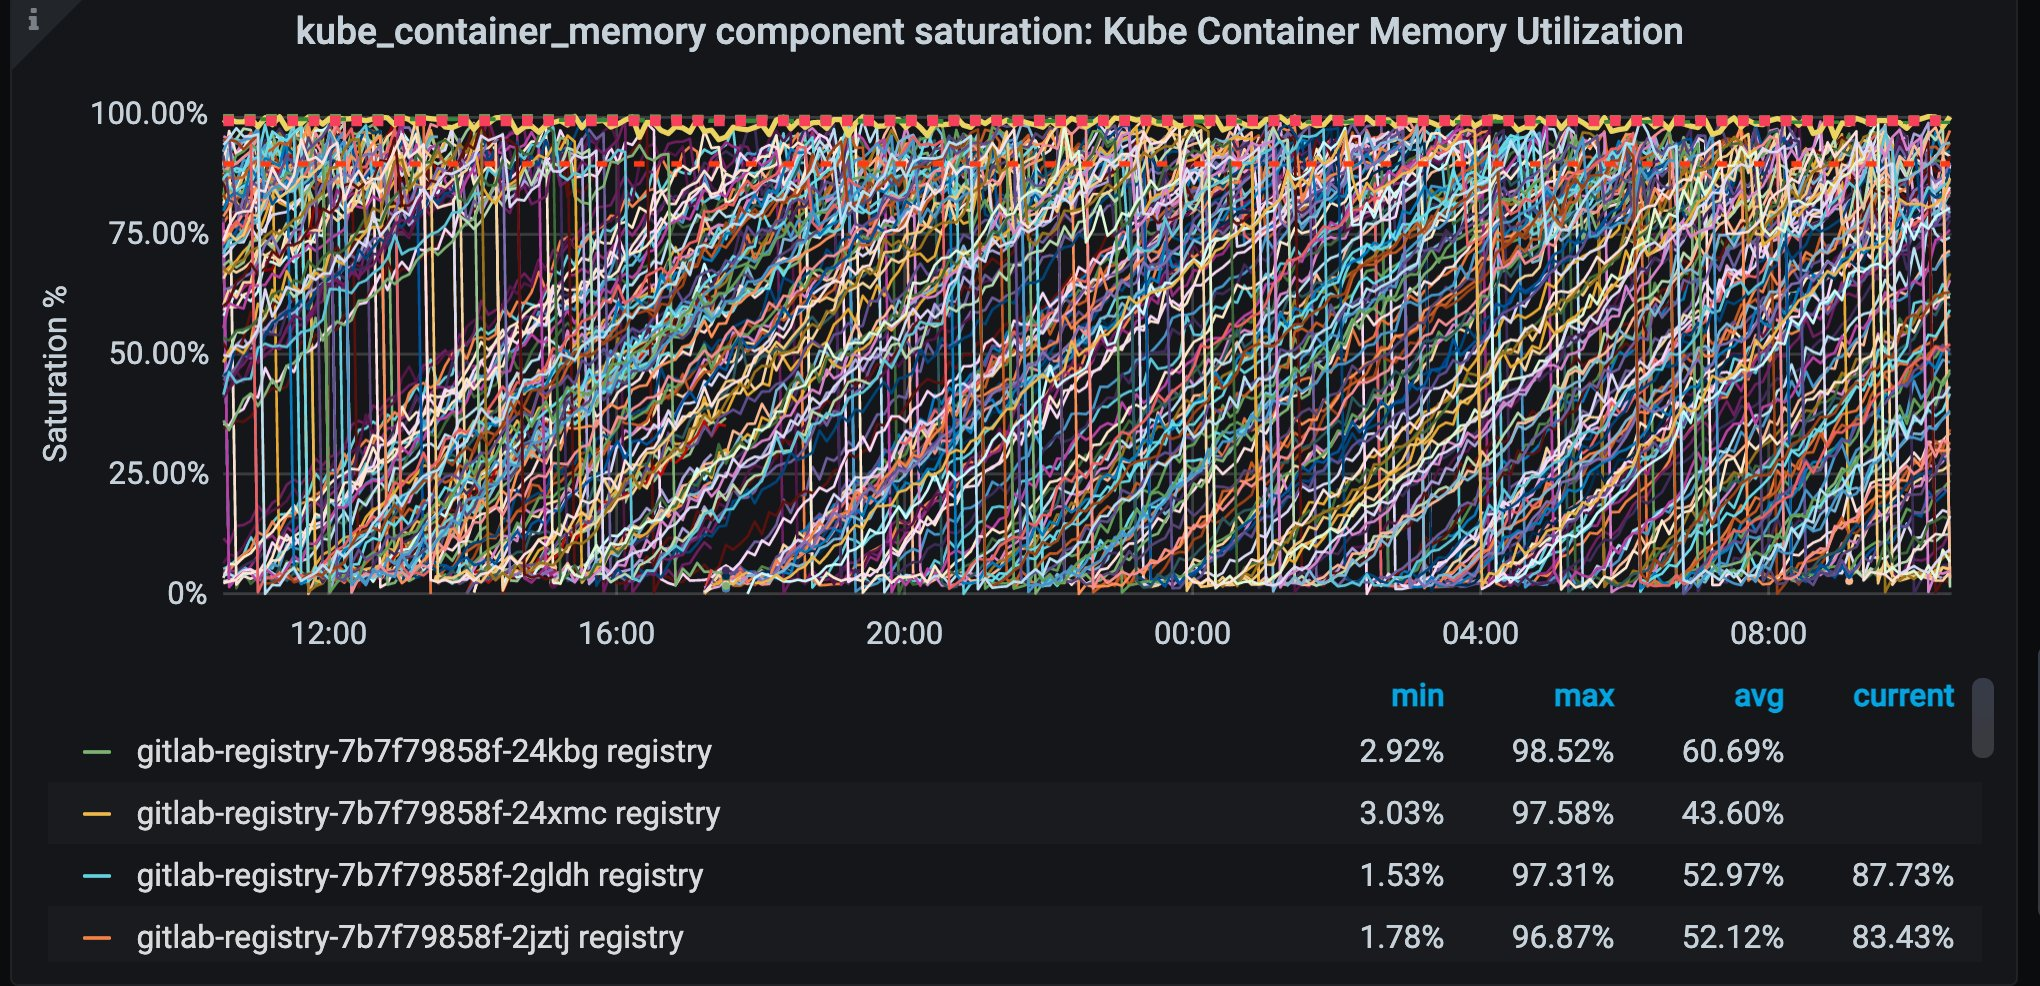
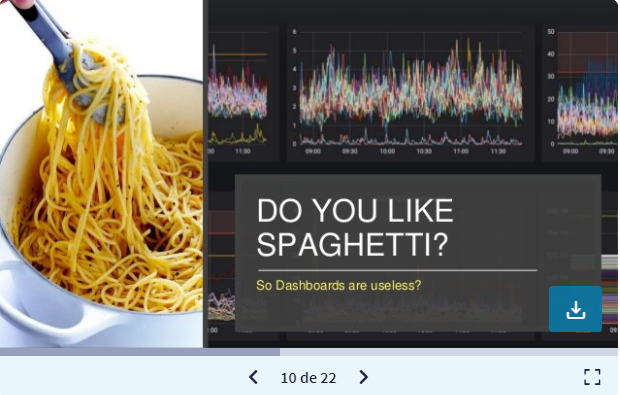
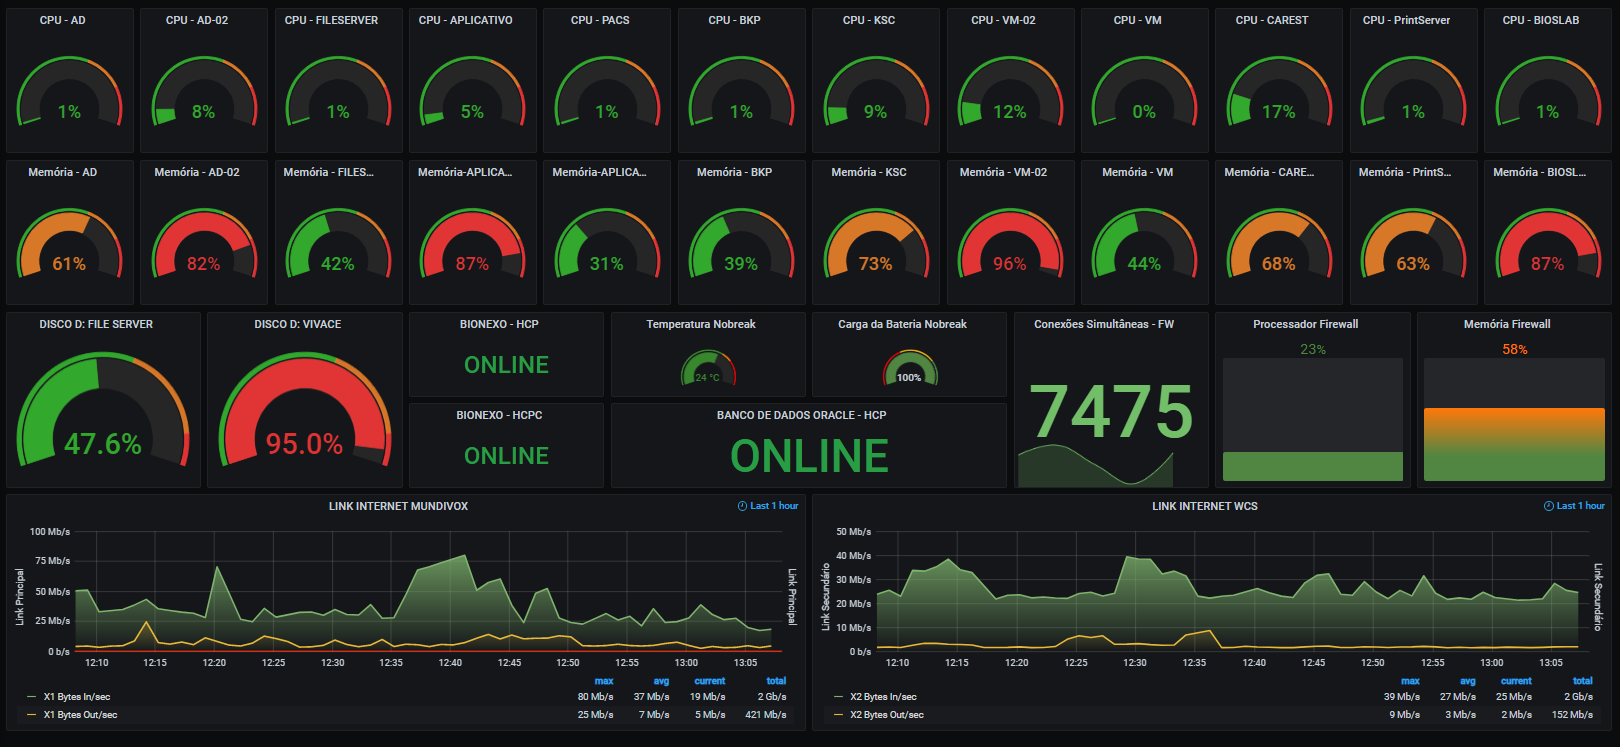
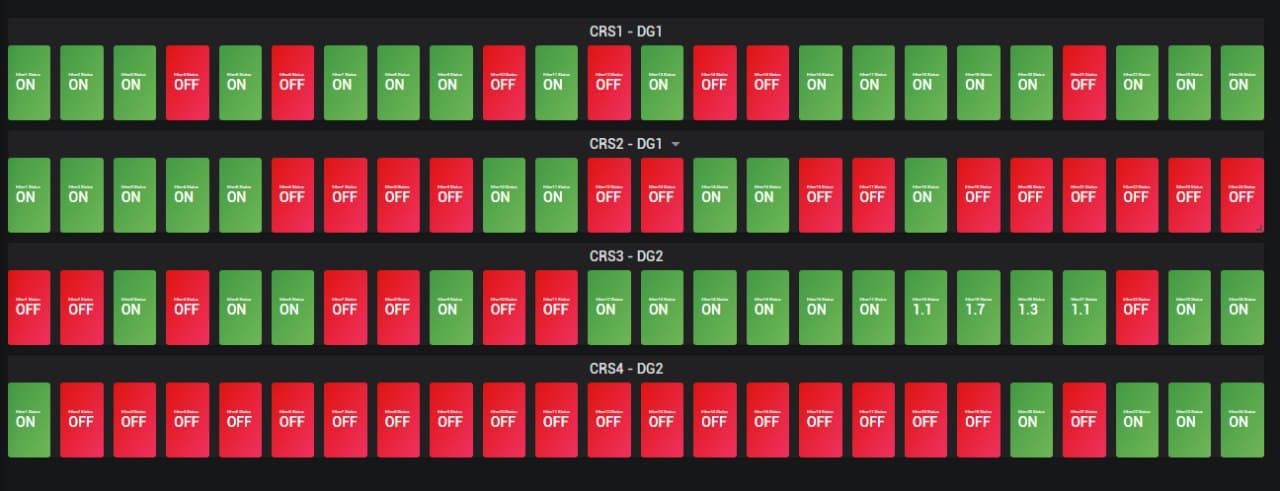
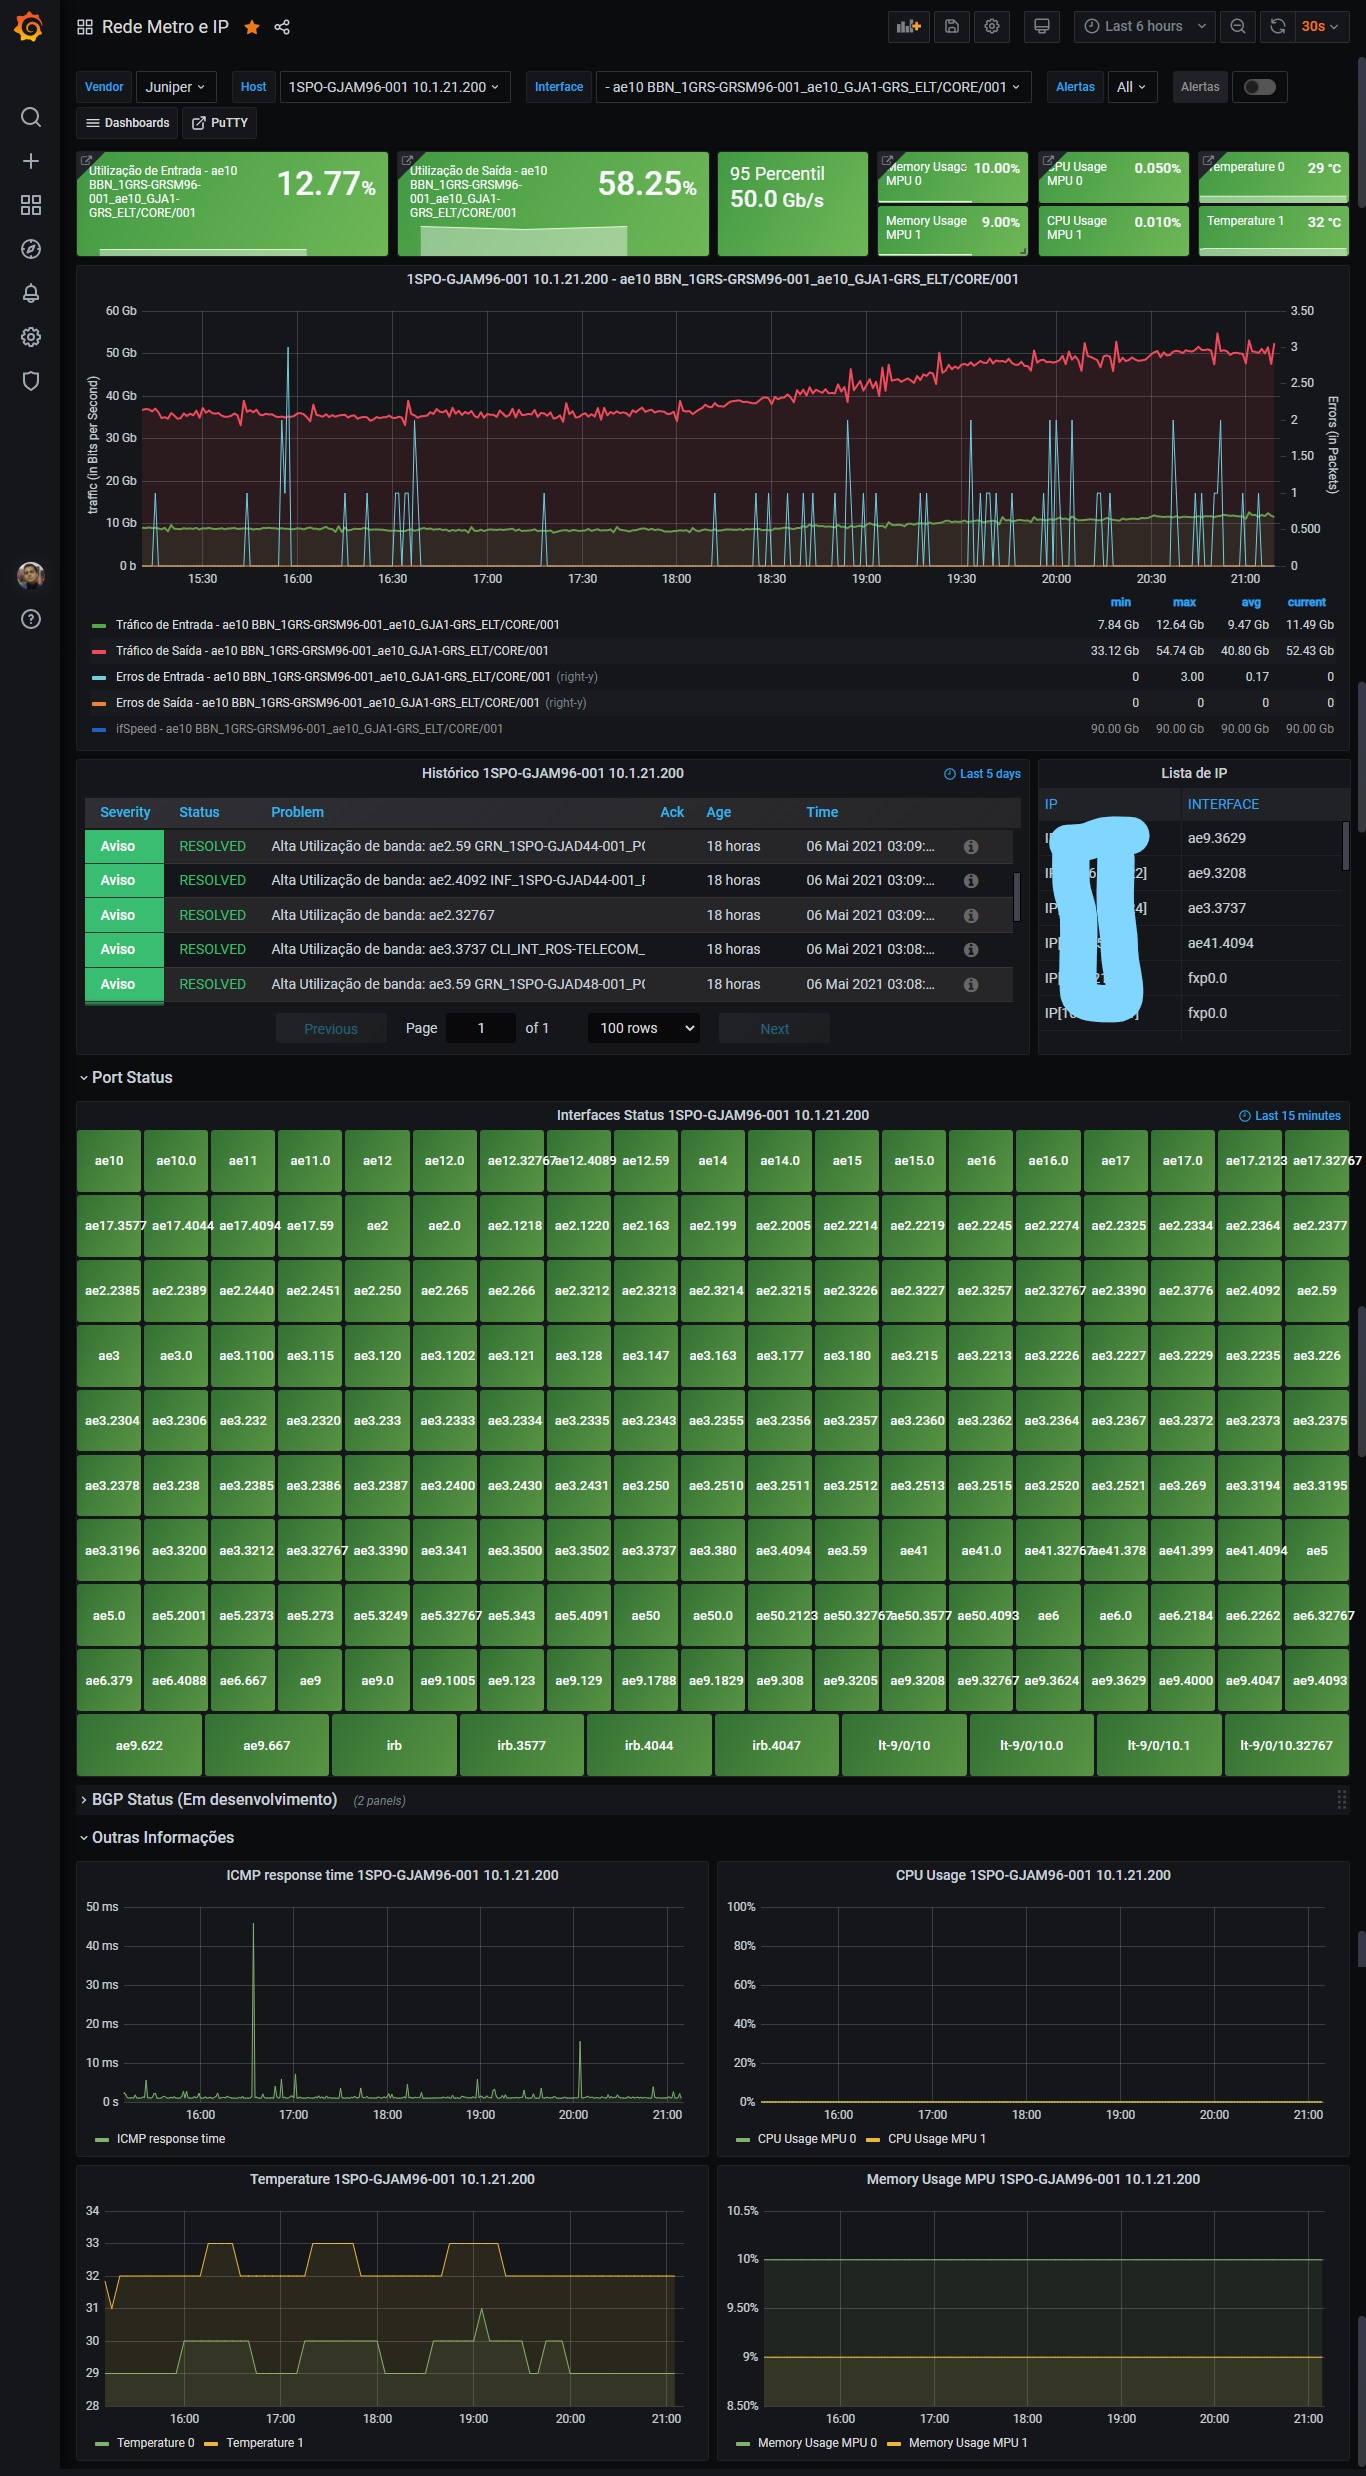
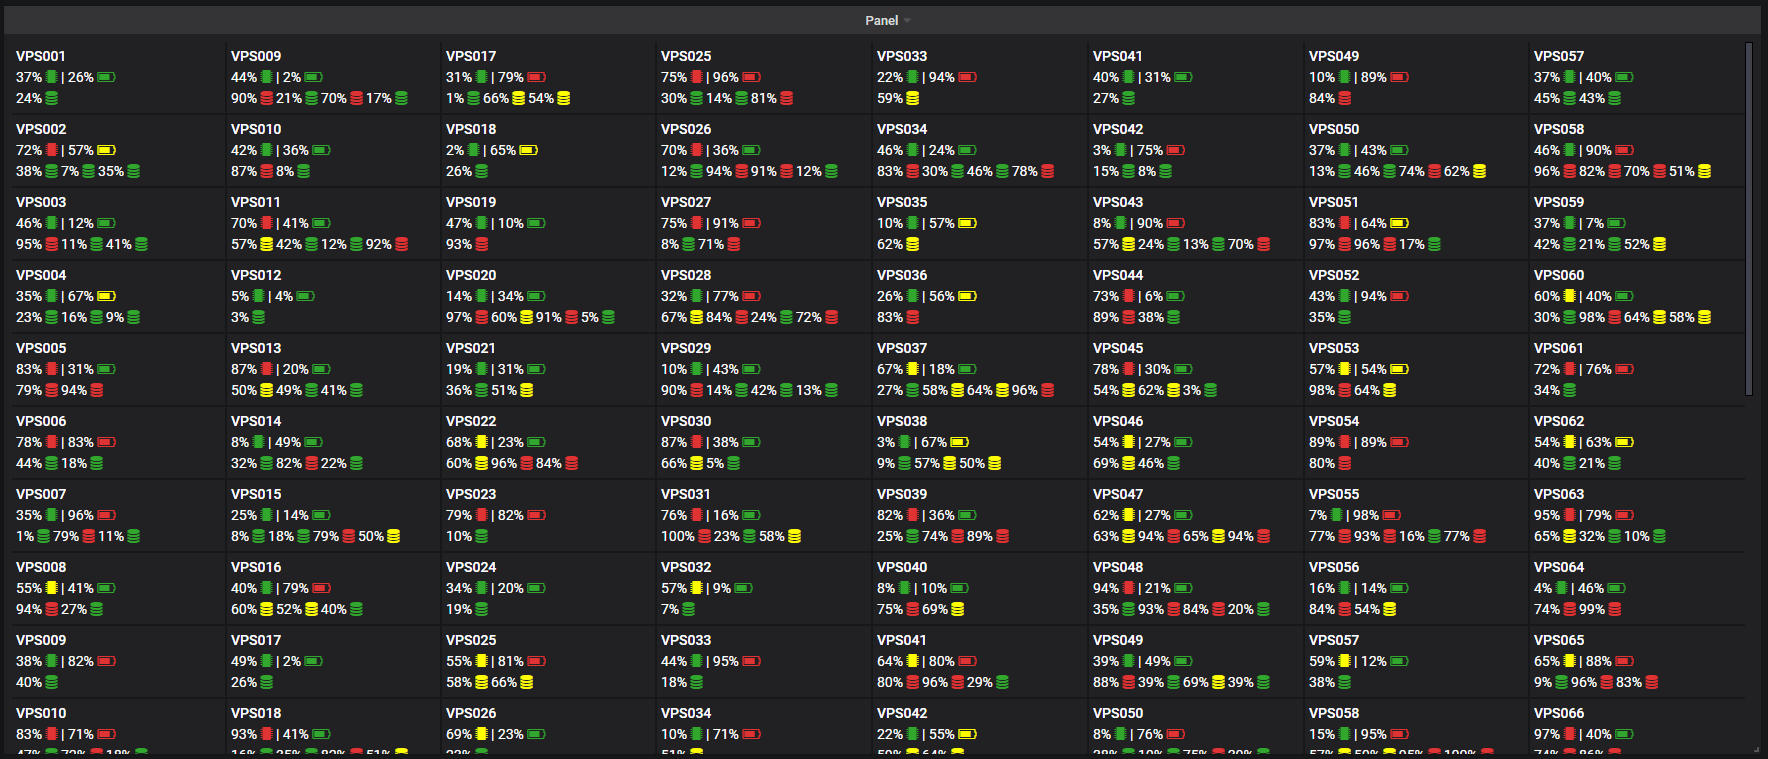
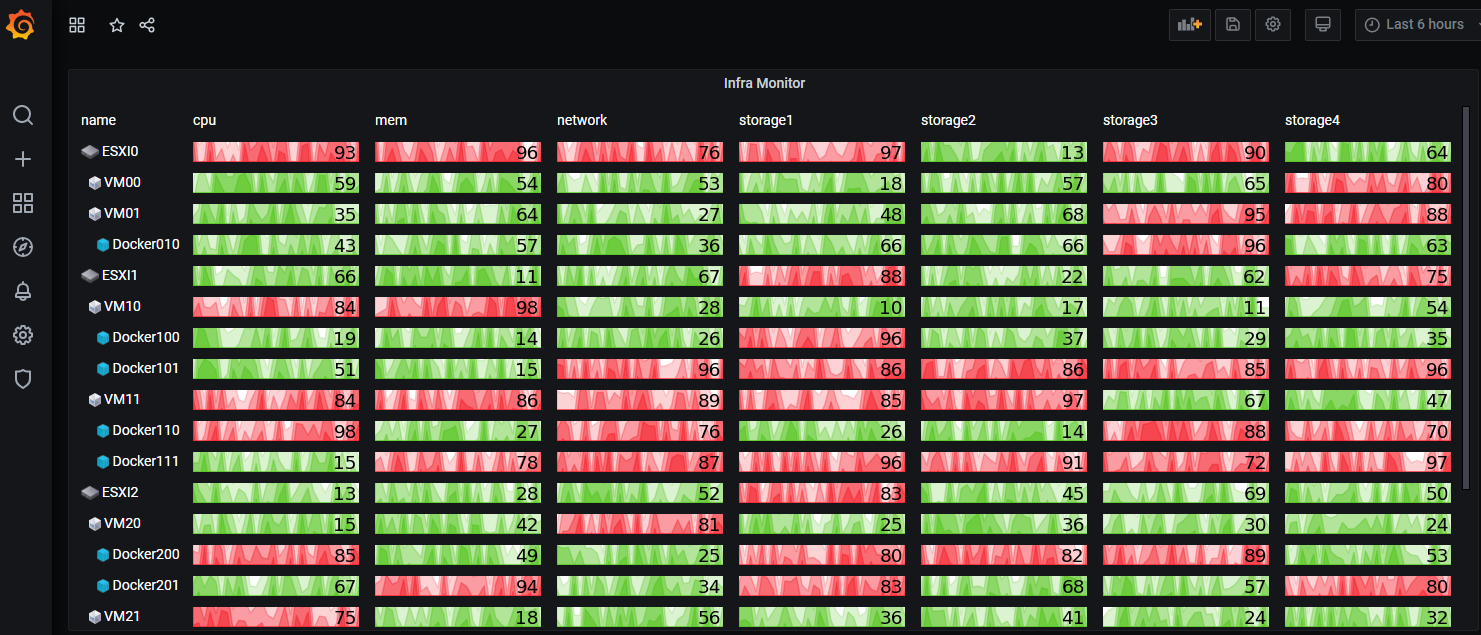
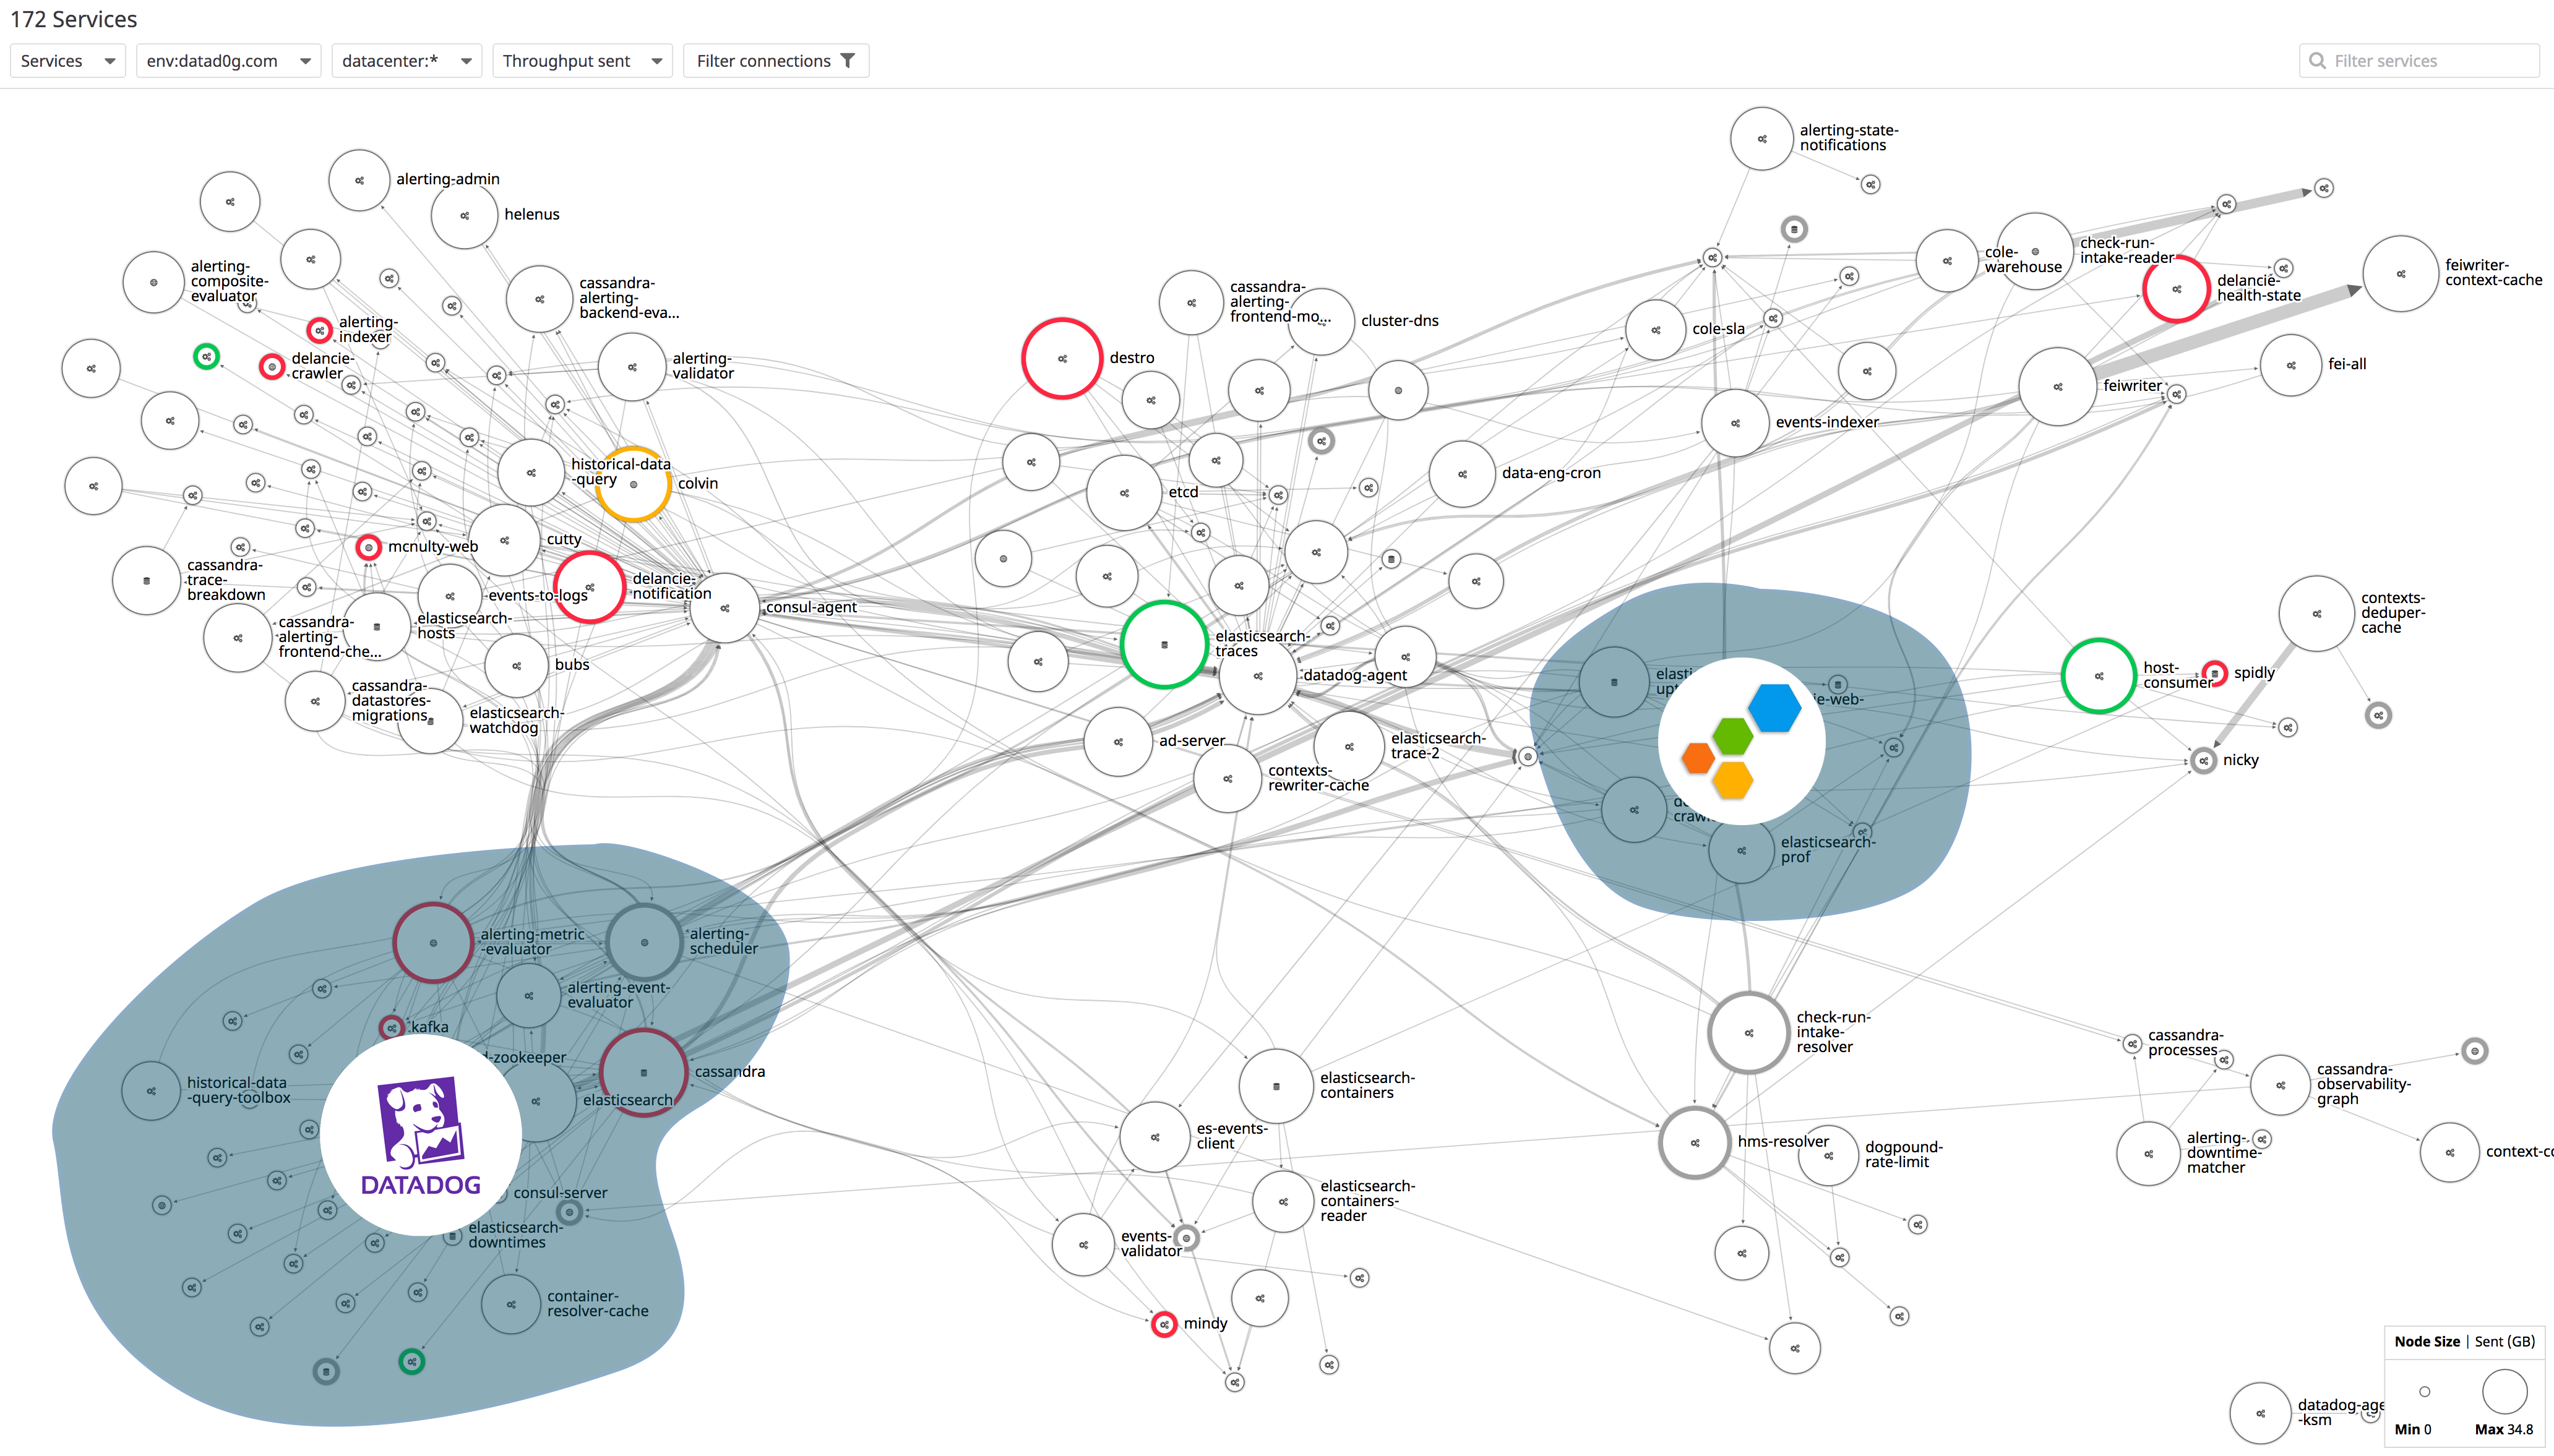
Spaghetti Dash
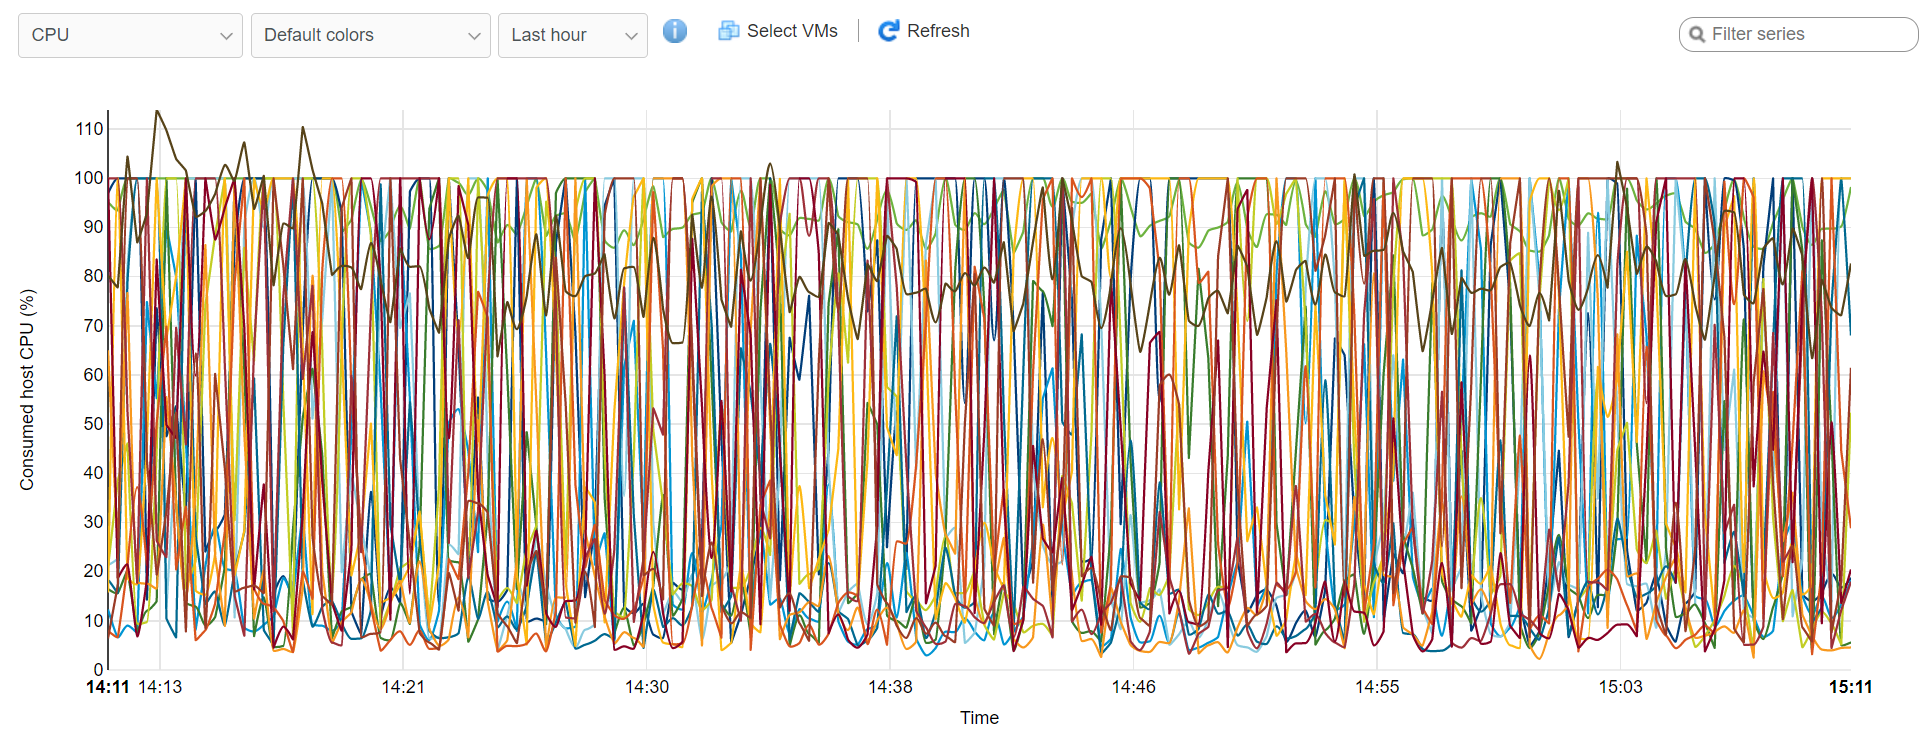
https://github.com/leeoniya/uPlot/issues/108

https://twitter.com/suprememoocow/status/1392065948845215746/photo/1
https://twitter.com/suprememoocow/status/1398236948502827011/photo/1

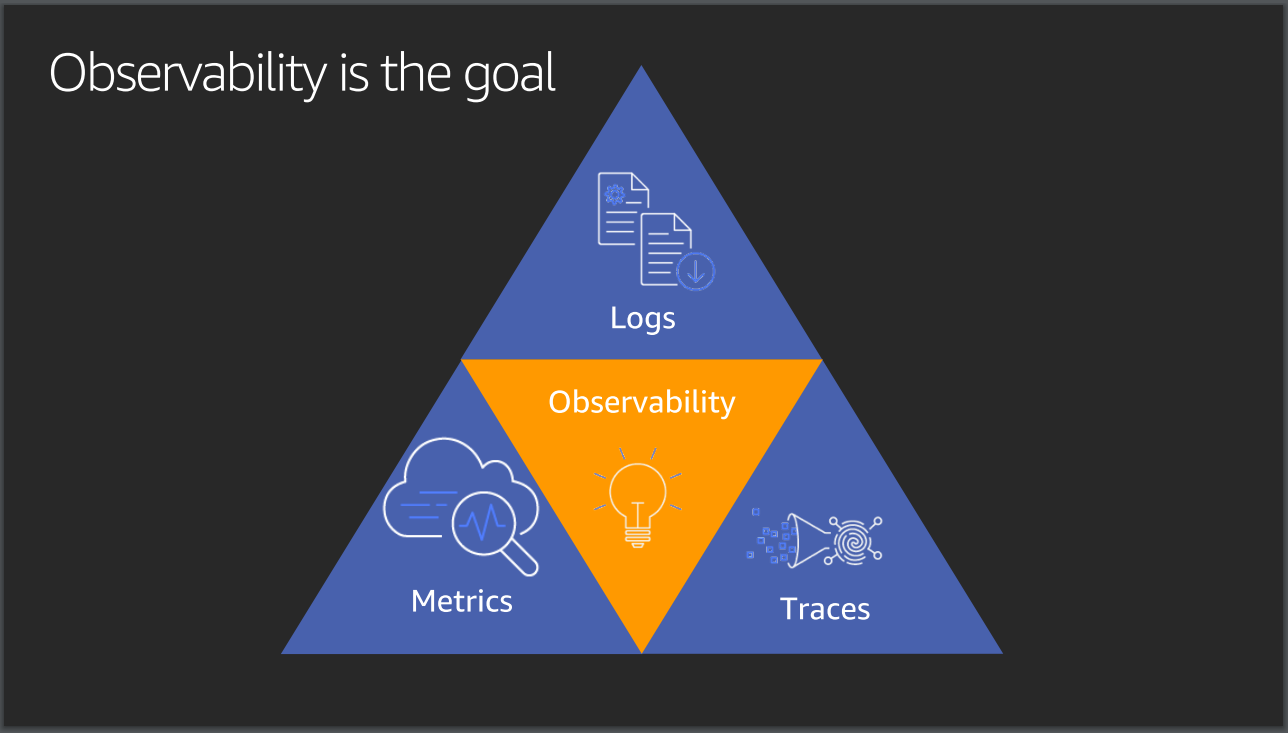
Why Dashboards Are Useless and Observability Is the New Buzzword
https://pt.slideshare.net/timetrix/why-dashboards-are-useless-and-observability-is-the-new-buzzword
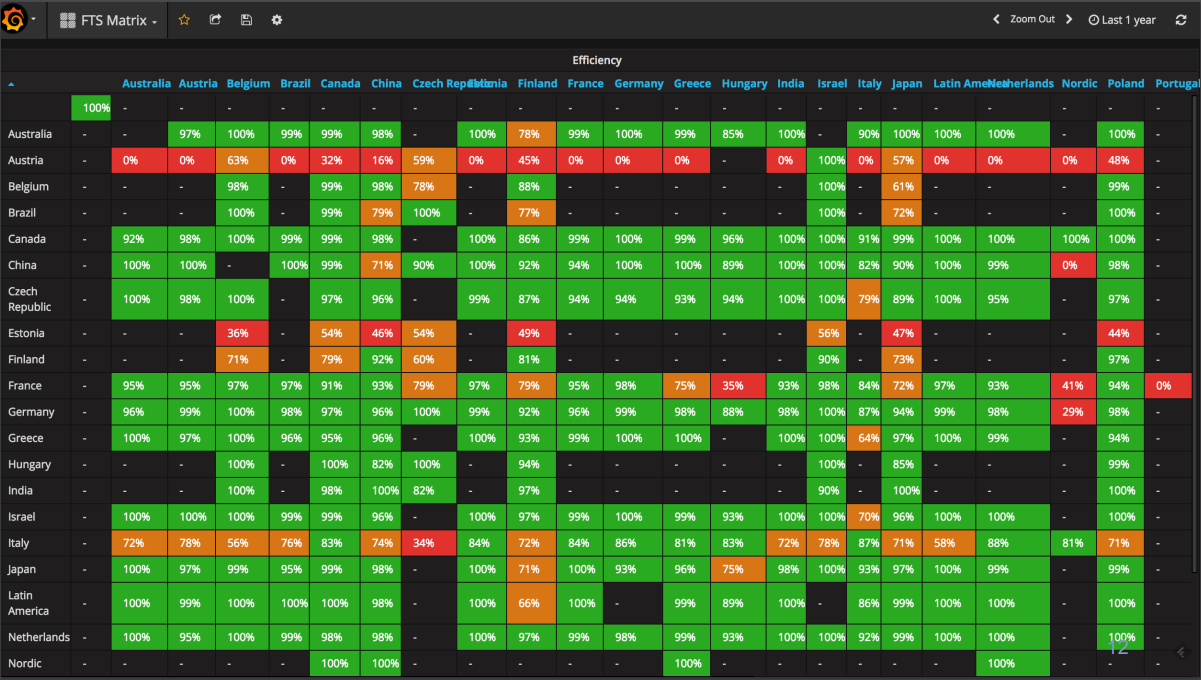
Example Dash
https://indico.cern.ch/event/639271/contributions/2591582/attachments/1460975/2256862/2017_05_WLCGTransfers.pdf
Dashboards Observability Perks
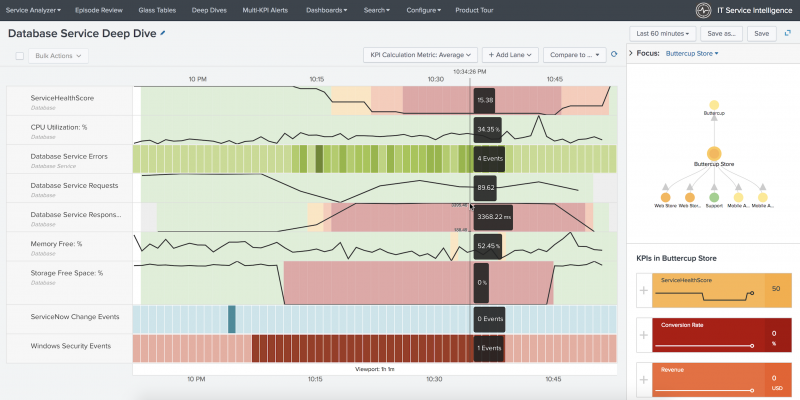
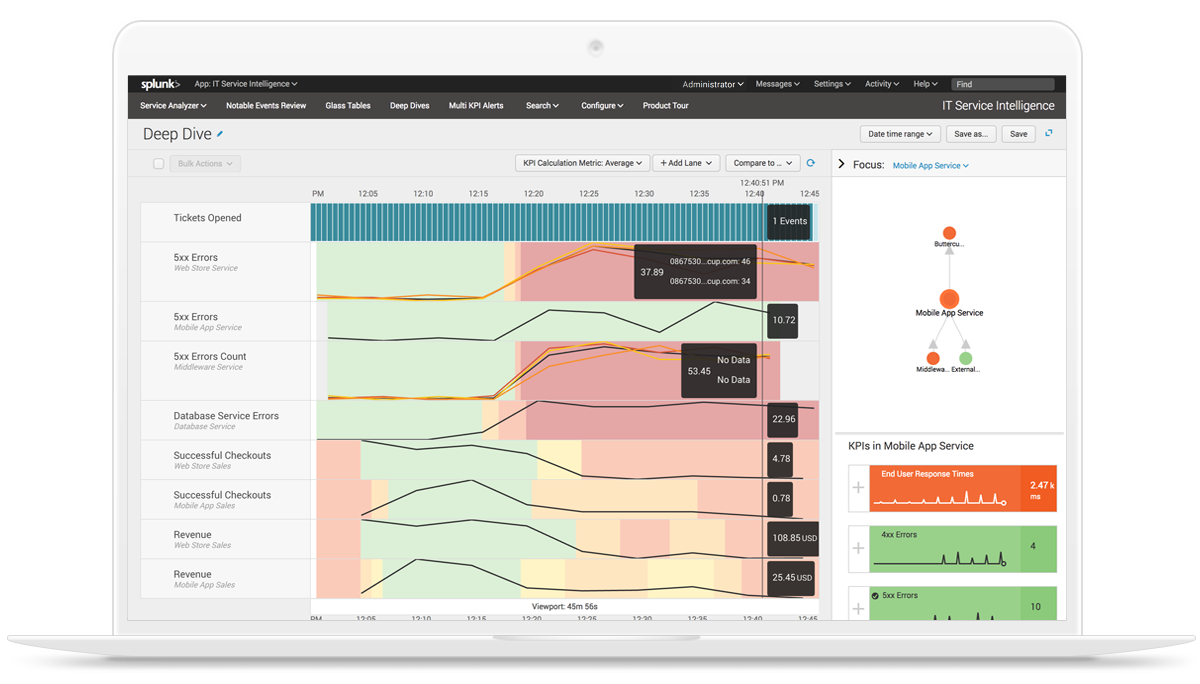
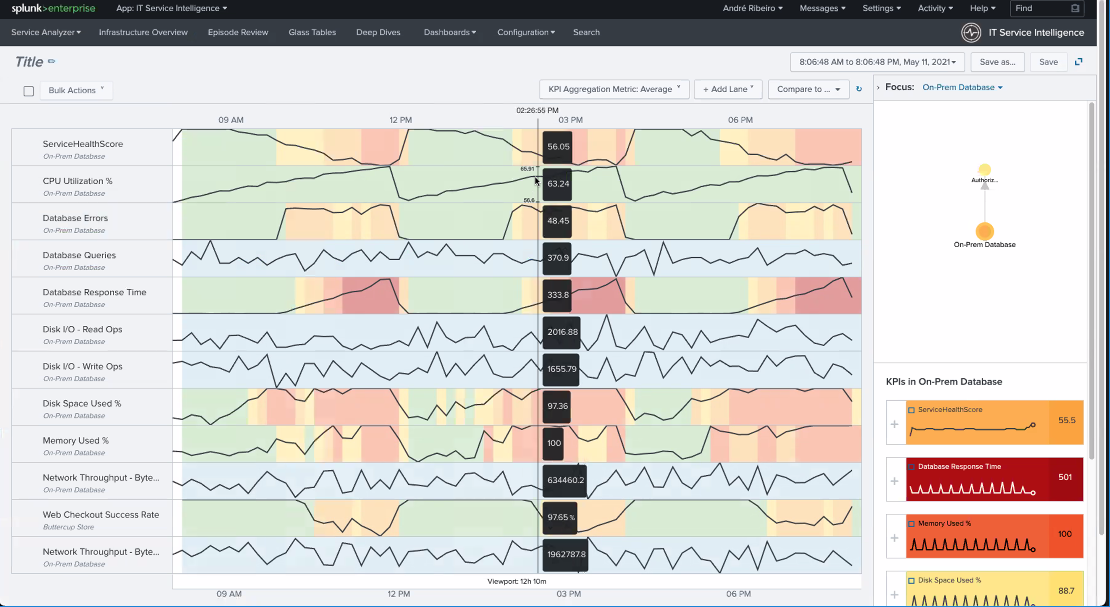
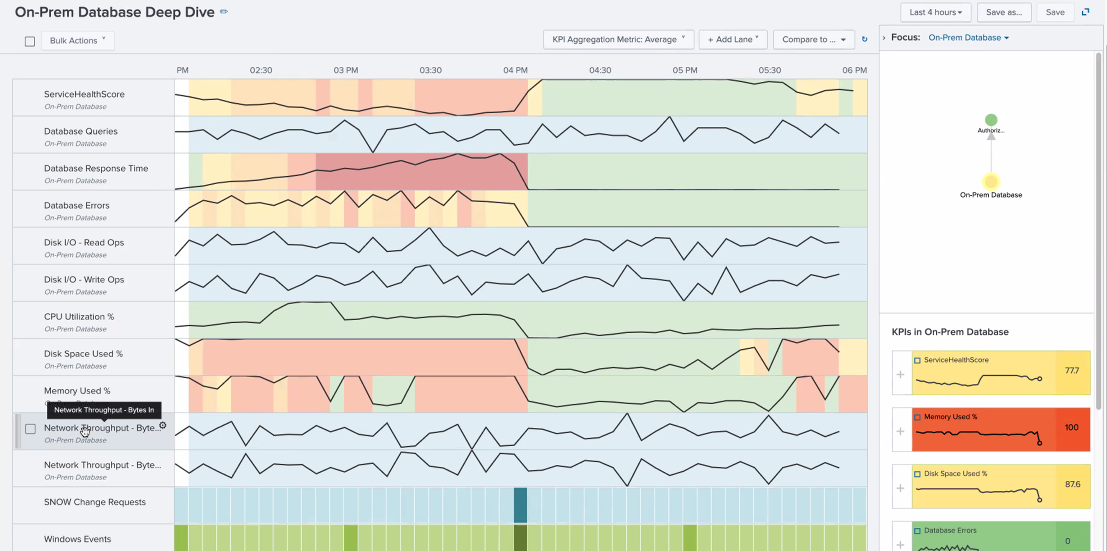
https://docs.splunk.com/Documentation/ITSI/4.10.2/SI/DeepDives
Phantom Cyber Corporation Splunk Computer Software Orchestration Privately Held Company
https://splunkbase.splunk.com/app/4261/
https://twitter.com/mattdavies_uk/status/932906148155527168
https://twitter.com/RKela/status/1159117734426398720 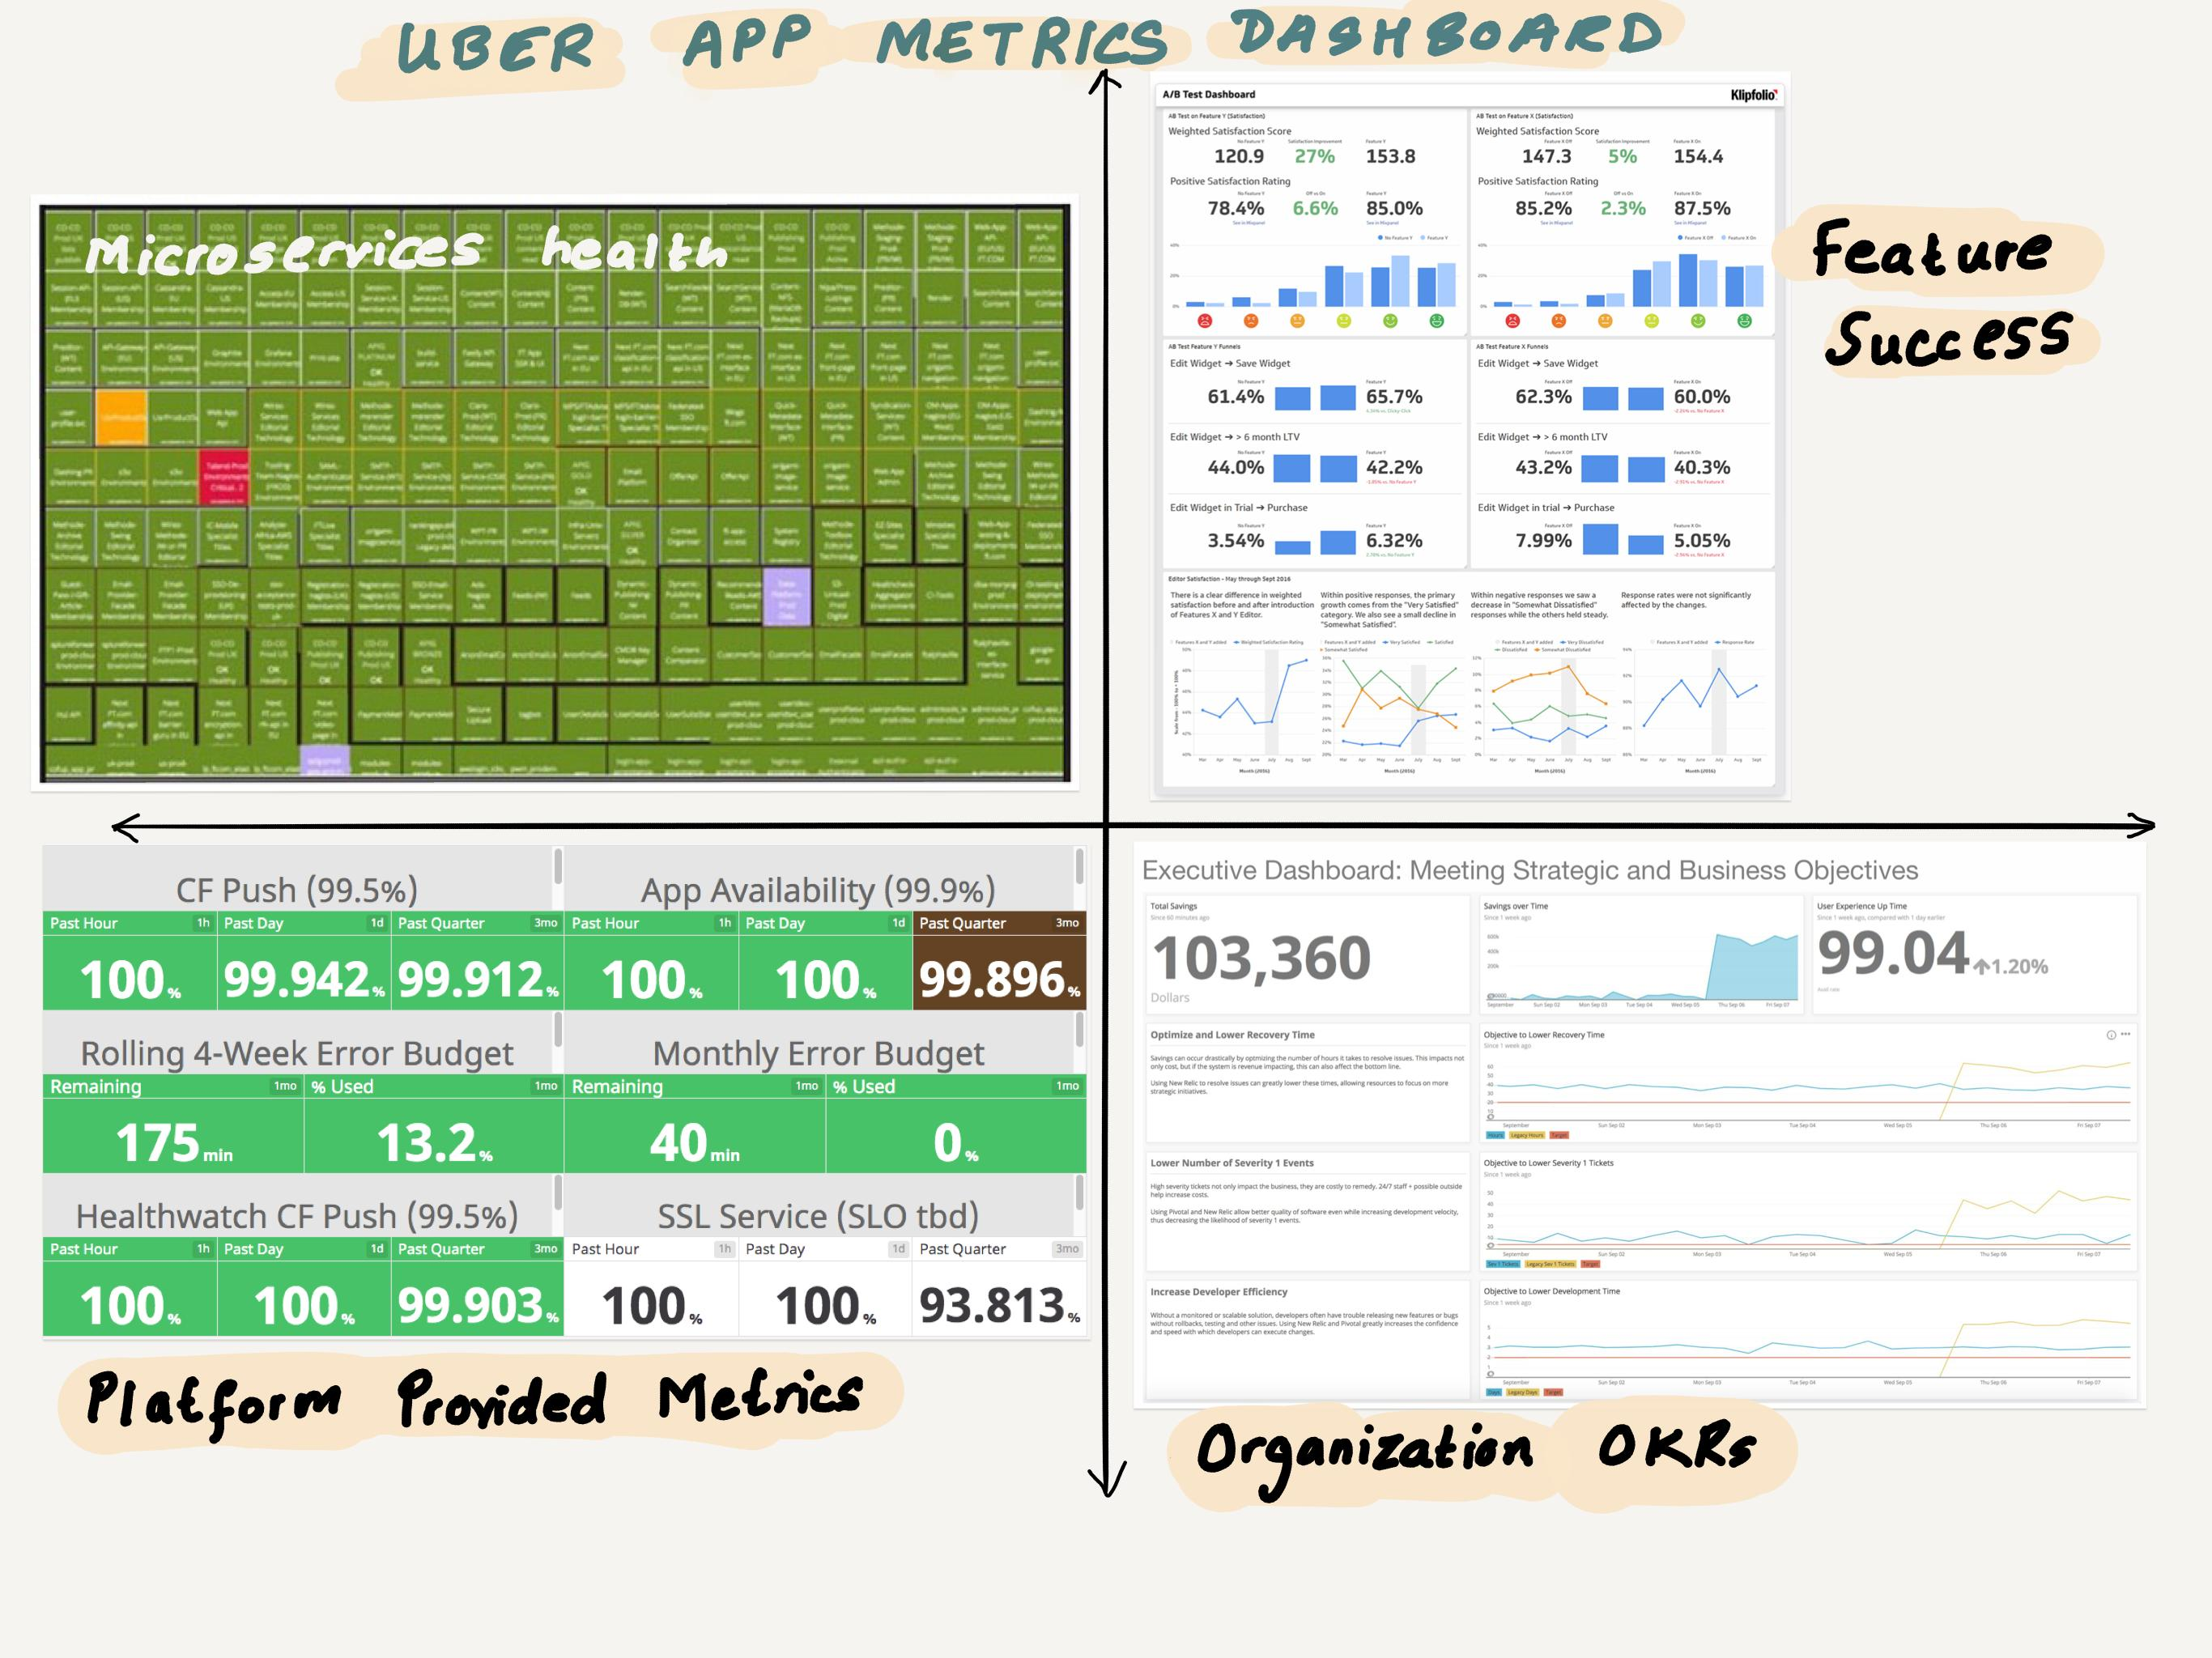
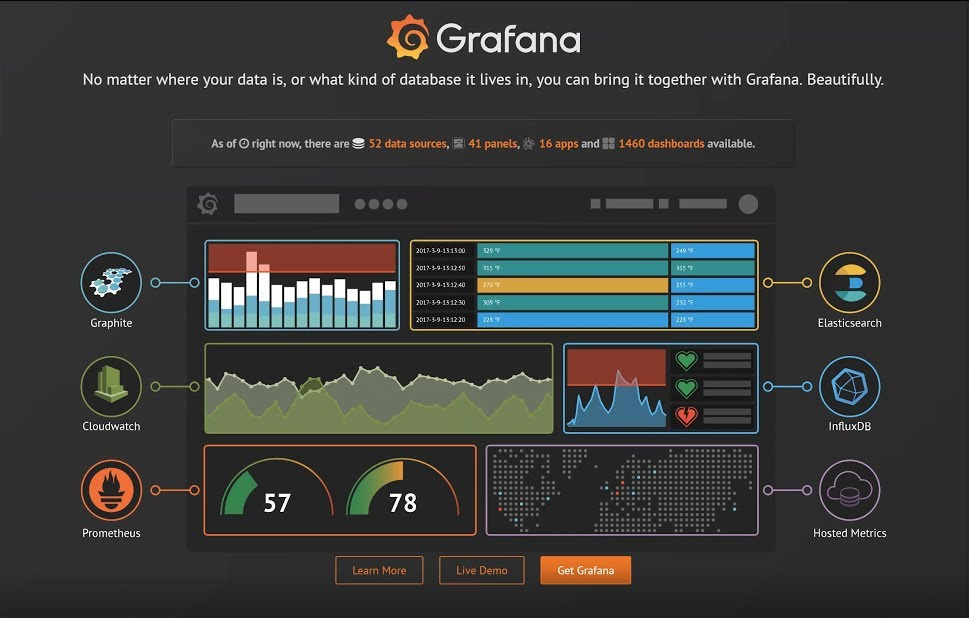
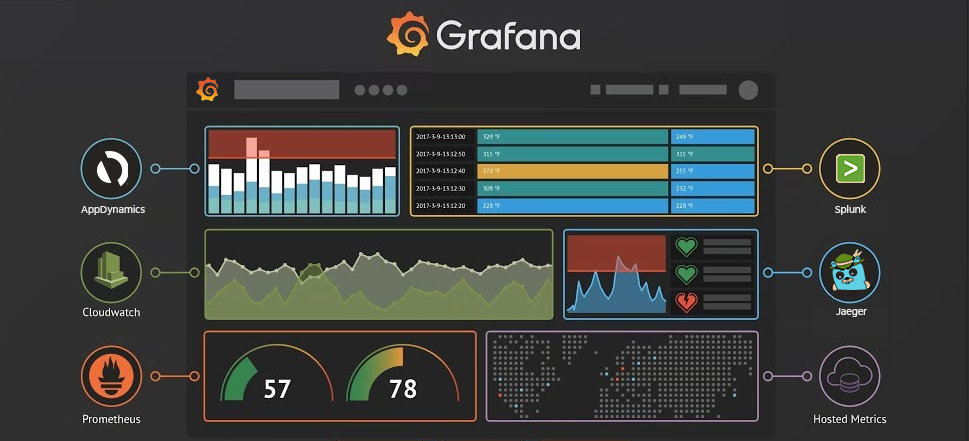
Grafana Many Datasources
https://blog.zabbix.com/configuring-grafana-with-zabbix/8007/
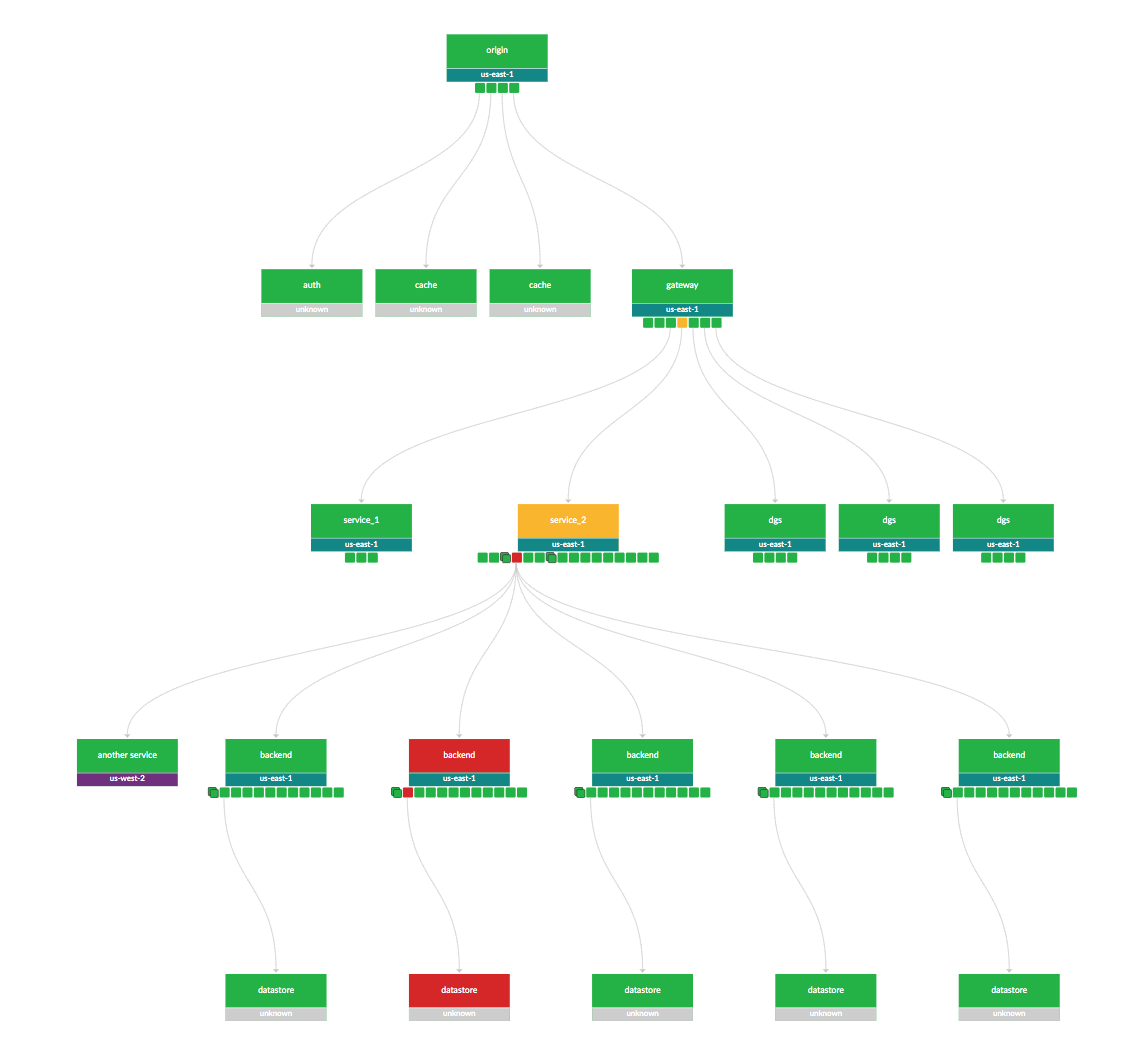
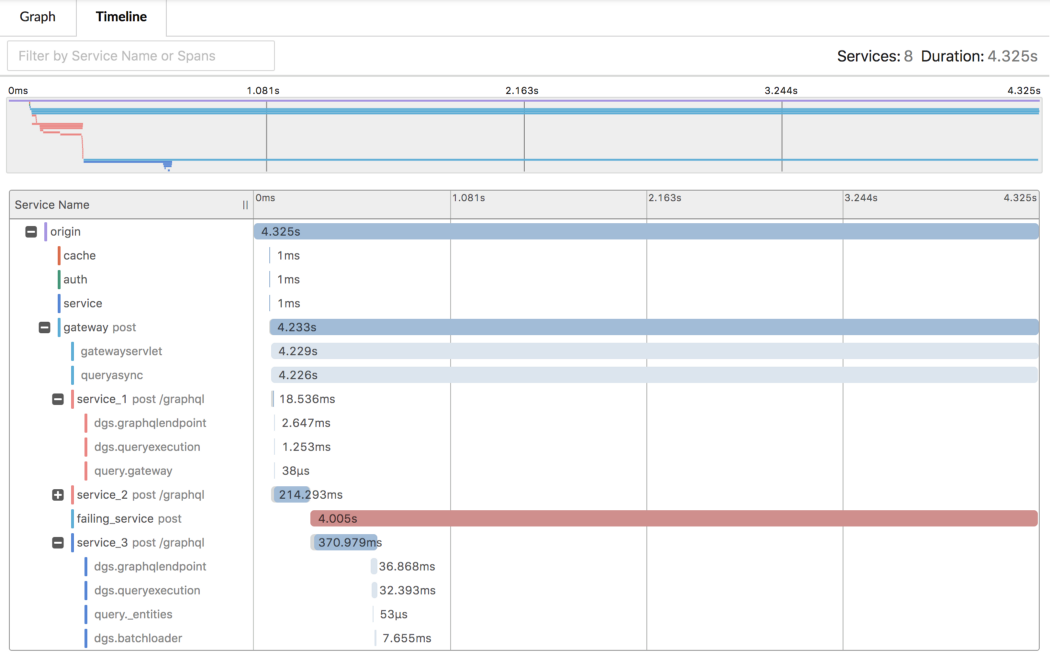
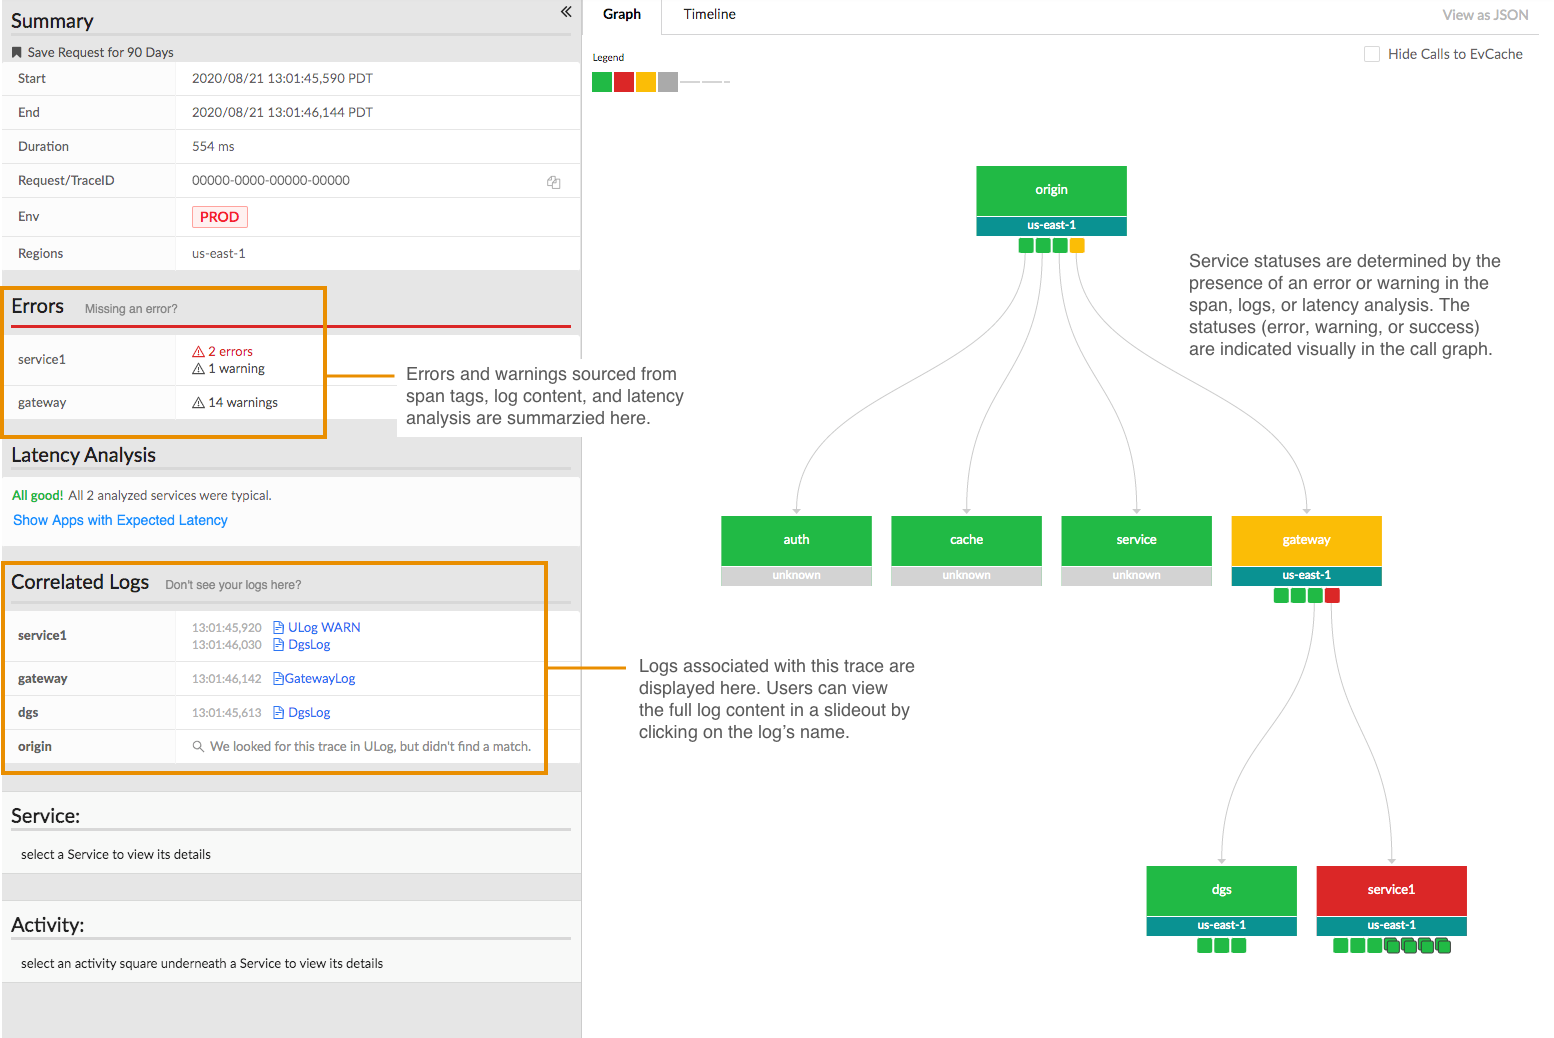
Netflix Edgar
https://netflixtechblog.com/edgar-solving-mysteries-faster-with-observability-e1a76302c71f
Availability
https://manishsharma.blog/2020/02/04/design-for-availability-game-of-9s/

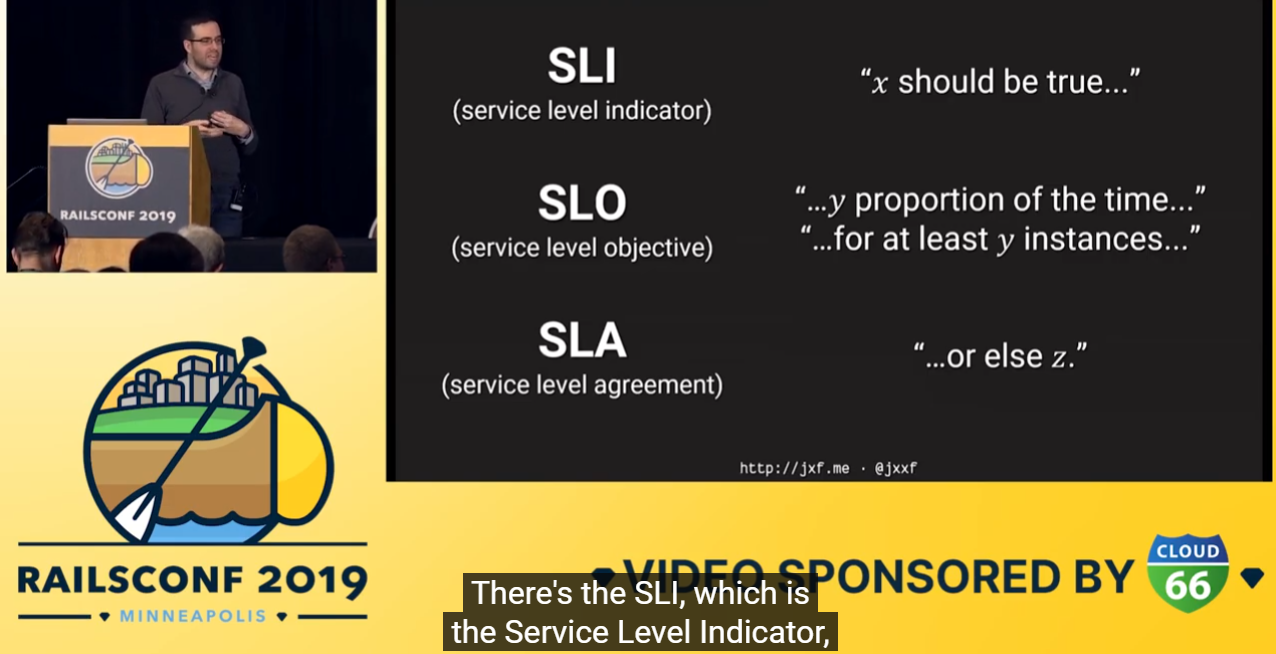
SLOs SLIs SLAs


distributed tracing dapper jaeger
https://logz.io/blog/distributed-tracing-dapper-jaeger/

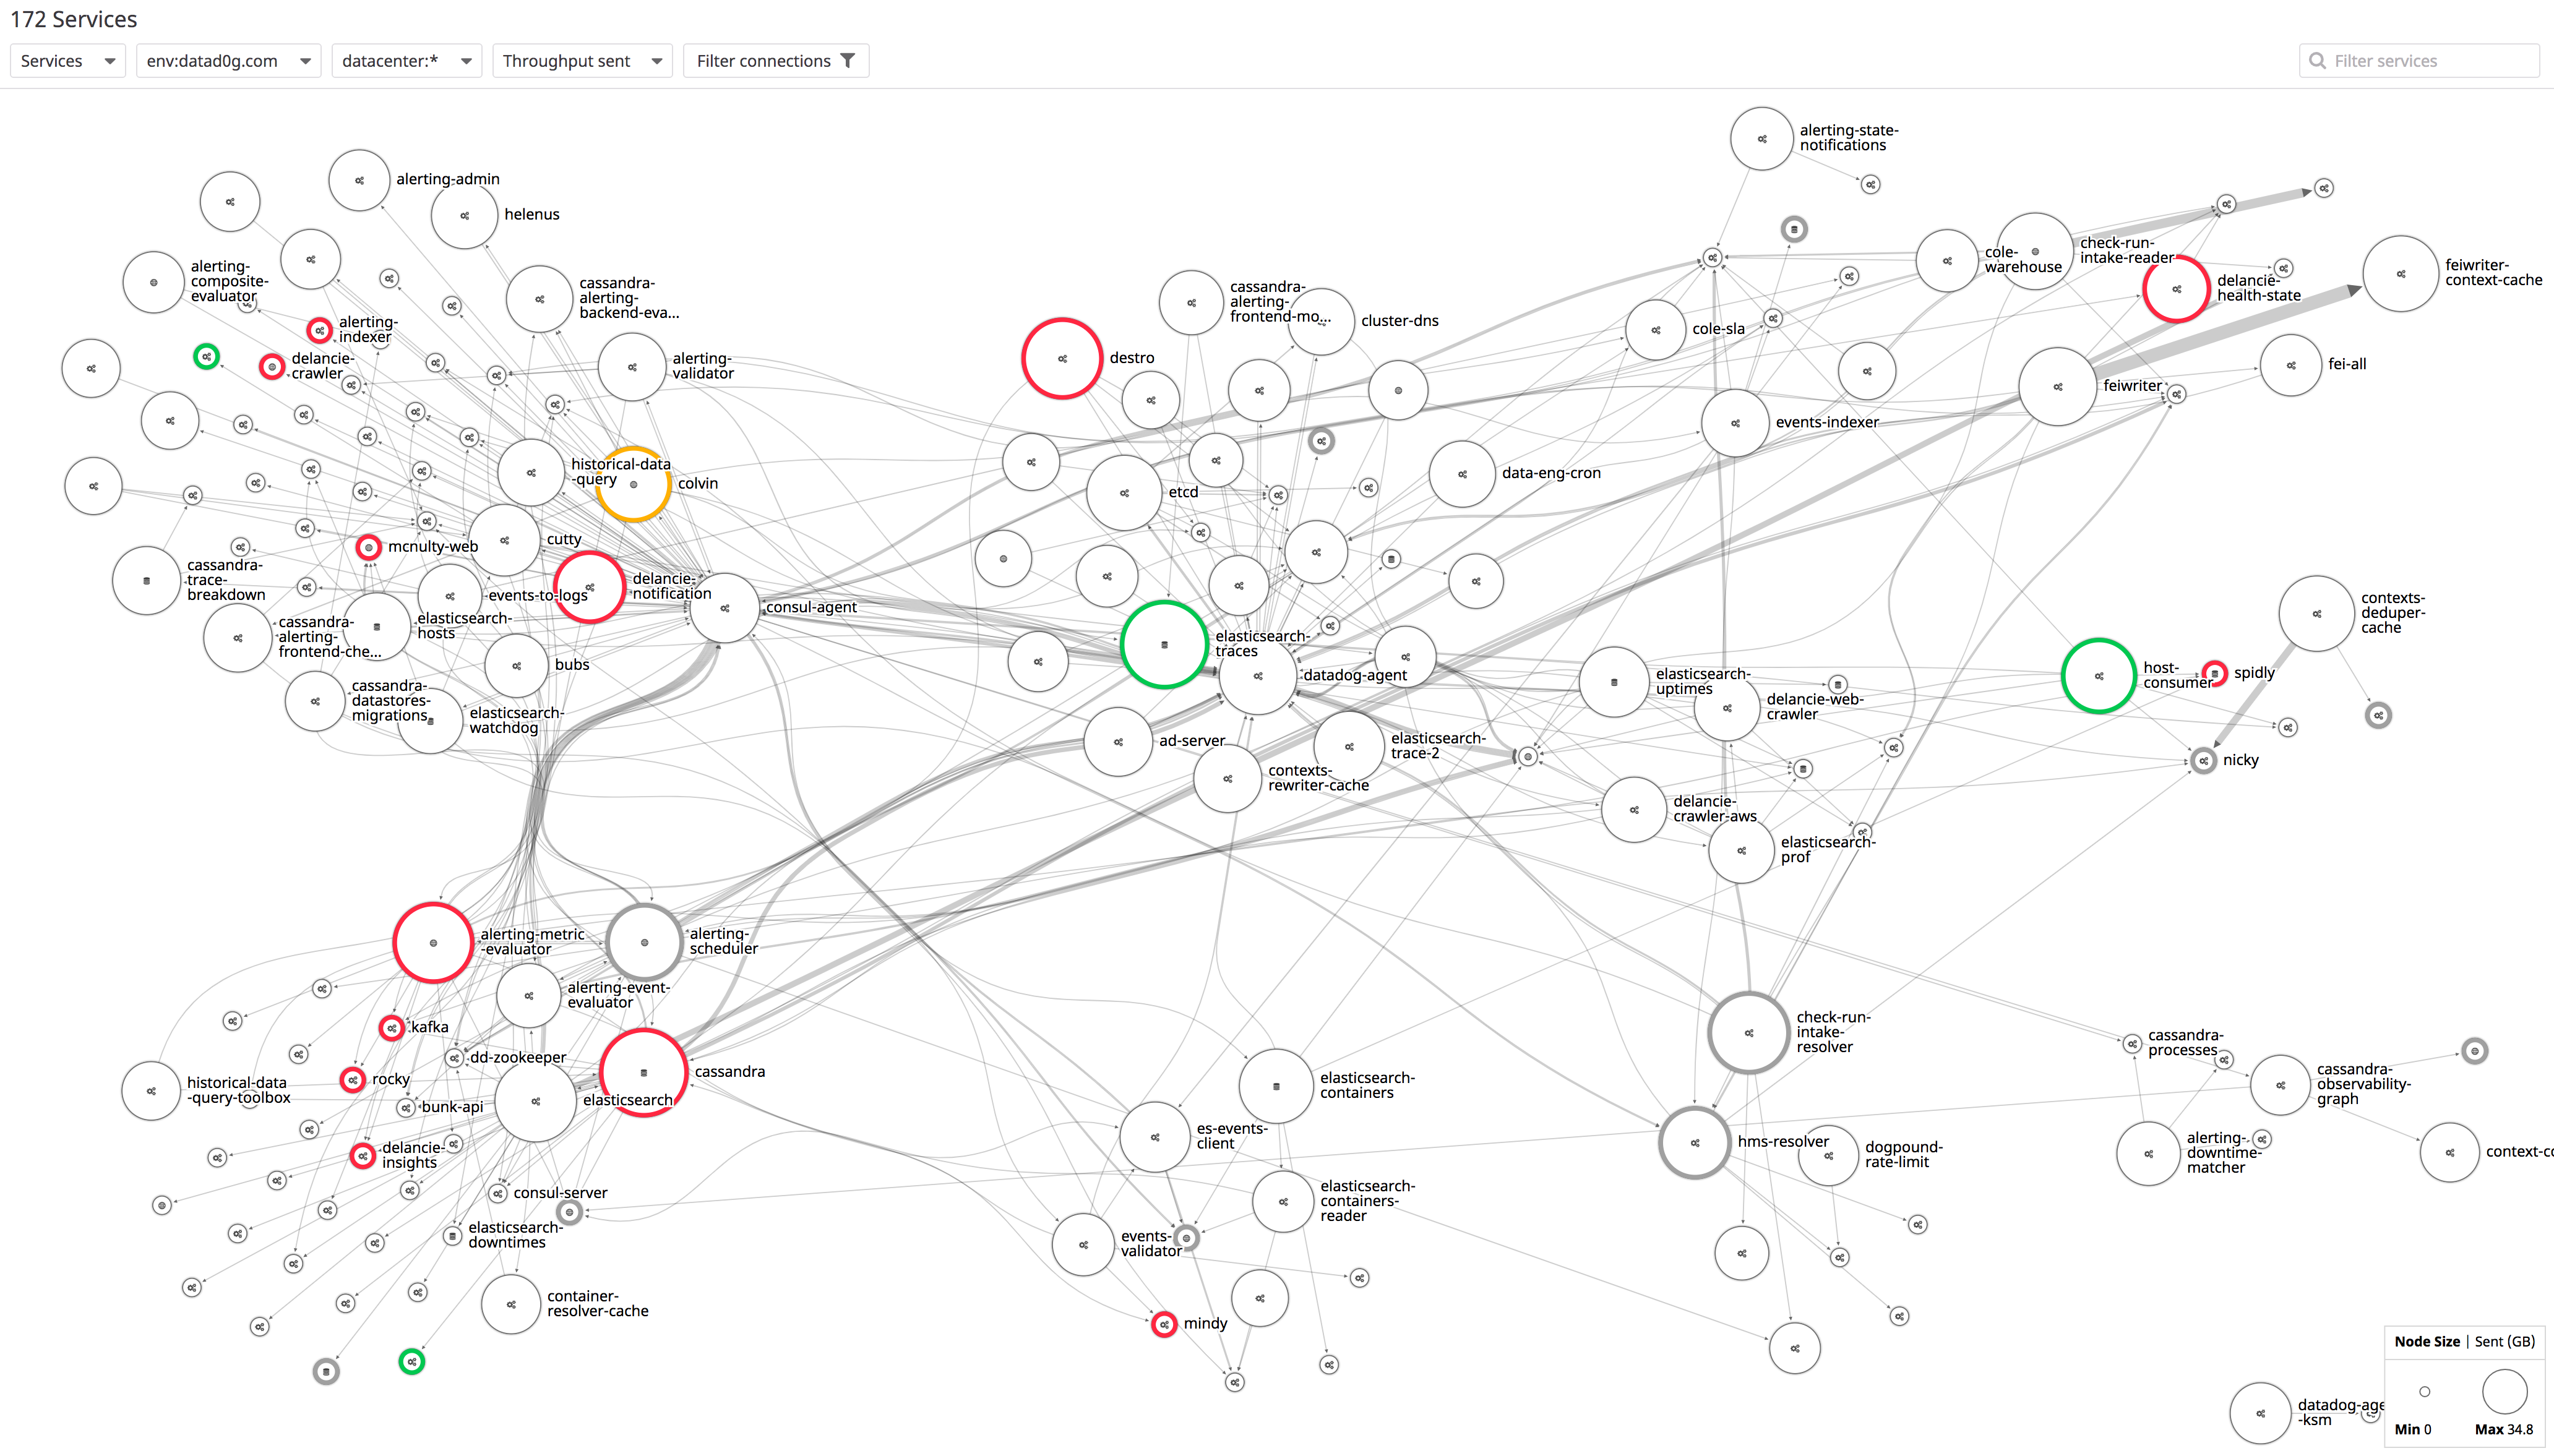
https://eng.uber.com/microservice-architecture/
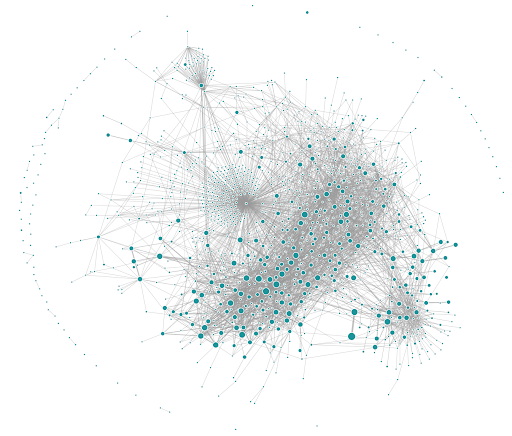
Uber’s microservice architecture circa mid-2018 from Jaeger
monitoring data quality at scale
https://eng.uber.com/monitoring-data-quality-at-scale/

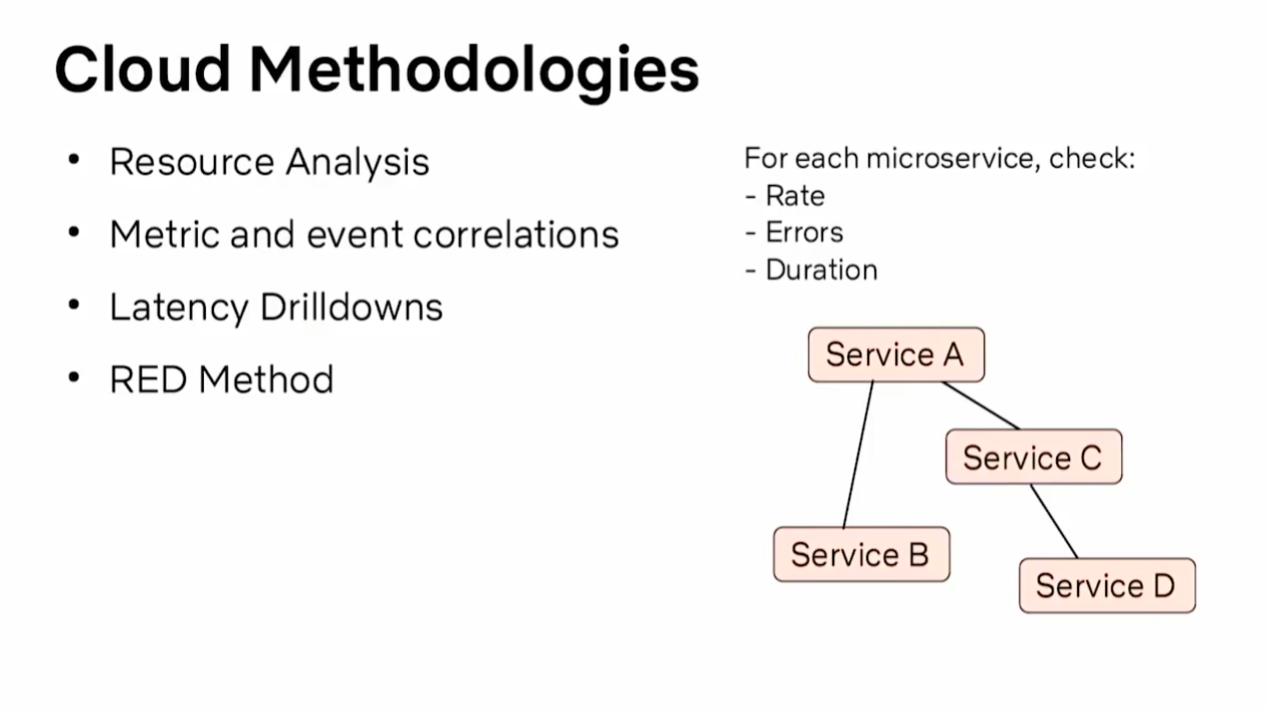
Critical Path Analysis for Microservice Architectures
https://eng.uber.com/crisp-critical-path-analysis-for-microservice-architectures/
Introducing uGroup: Uber’s Consumer Management Framework
https://eng.uber.com/introducing-ugroup-ubers-consumer-management-framework/

Capacity Planning
A Systematic Approach to Capacity Planning in the Real World
https://www.slideshare.net/arunkejariwal/a-systematic-approach-to-capacity-planning-in-the-real-world
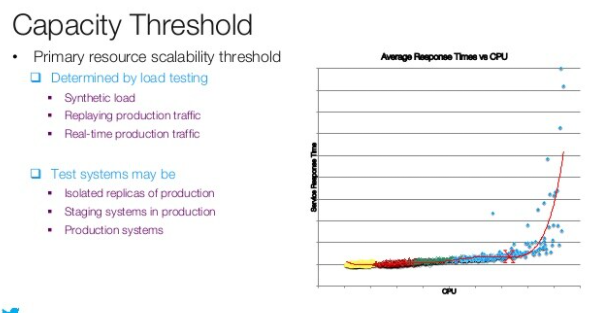
- Metrics
- Average, Standard deviation, 95th, 99th percentile
- Techniques
- Moving Average - EMA (exponential moving average)
- Correlation
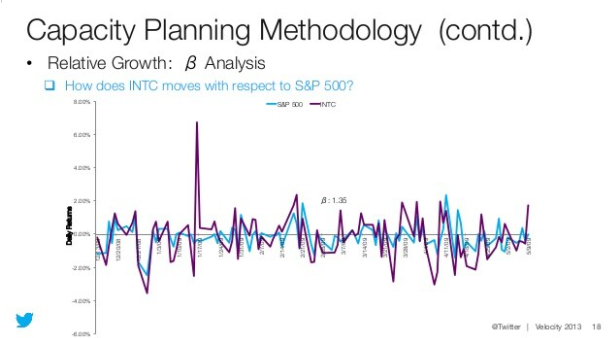
- Beta Analysis
- MACD
- Forecasting - ARIMA
- Limitations
- Changing usage patterns
- Organic growth, behavioral, cultural
- Changing usage patterns

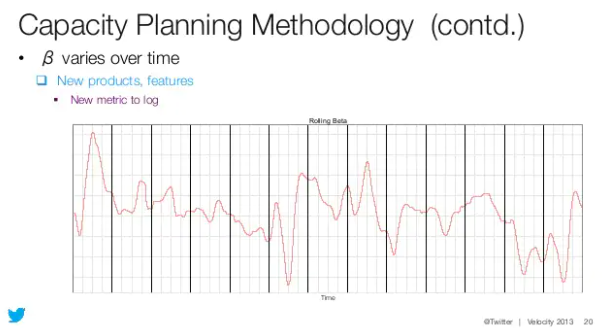
Beta analysis
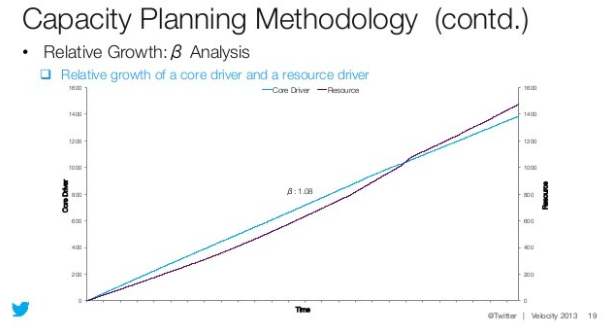
Rolling Beta
examples

Orientaçao utilizar AppDynamics
https://devops.com/wp-content/uploads/2019/07/Datadog-NPM.png
Flux: A New Approach to System Intuition

Imagine a suit that is wired with tens of thousands of electrodes.
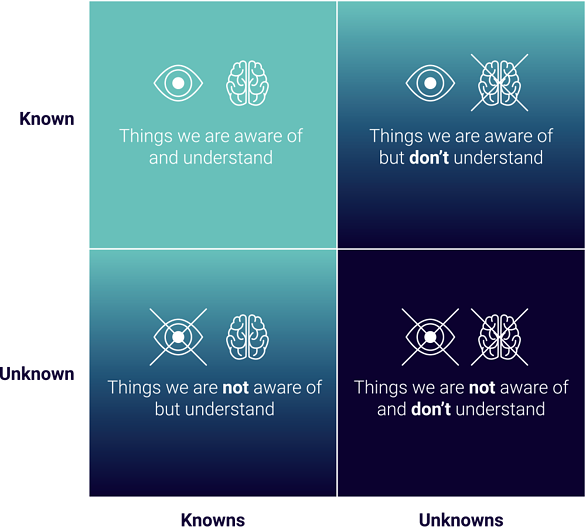
Unknown unknowns
https://thenewstack.io/how-comprehensive-observability-can-save-devops-from-unknown-unknowns/
Observability involves analyzing “unknown unknowns versus known unknowns,” Fong-Jones said. “Monitoring was about measuring things that you knew to predict in advance, whereas observability helps you understand how and why.”
https://blog.paessler.com/the-future-of-monitoring-the-rise-of-observability
https://devops.com/visualize-logs-to-get-more-value-from-data/

SREcon19 Asia/Pacific - Why Does My Monitoring Suck?

SREcon22 Americas - A Fresh Look at Operational Debt
https://youtu.be/oeFpJv-ujXM?list=PLbRoZ5Rrl5leMkjJdKIOI-vOxMVr7U5w_&t=846

Talks
YOW! 2018 Brendan Gregg - Cloud Performance Root Cause Analysis at Netflix #YOW

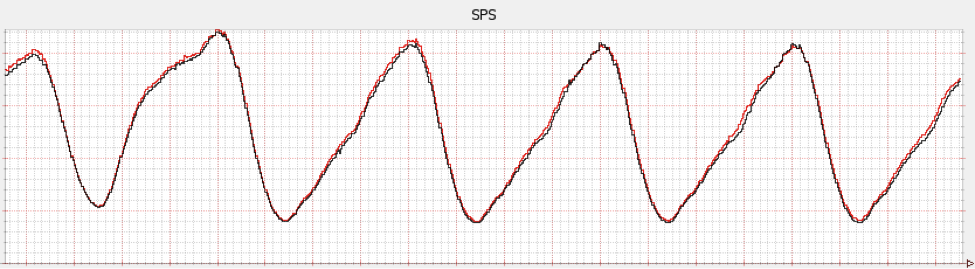
SPS
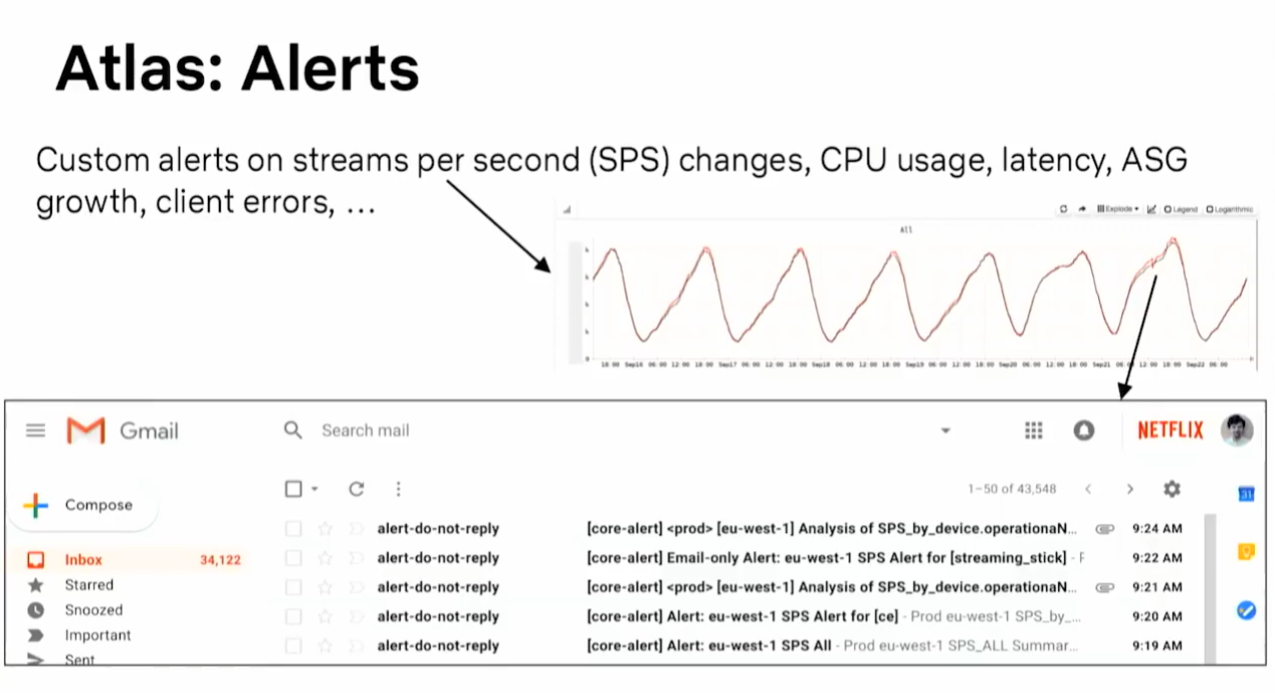
https://netflixtechblog.com/sps-the-pulse-of-netflix-streaming-ae4db0e05f8a

Charity Majors - HoneyComb
SREcon18 Europe - Observability for Emerging Infra: What Got You Here Won’t Get You There
You have an observable system when your team can quickly and reliably track down any new problem with no prior knowledge.
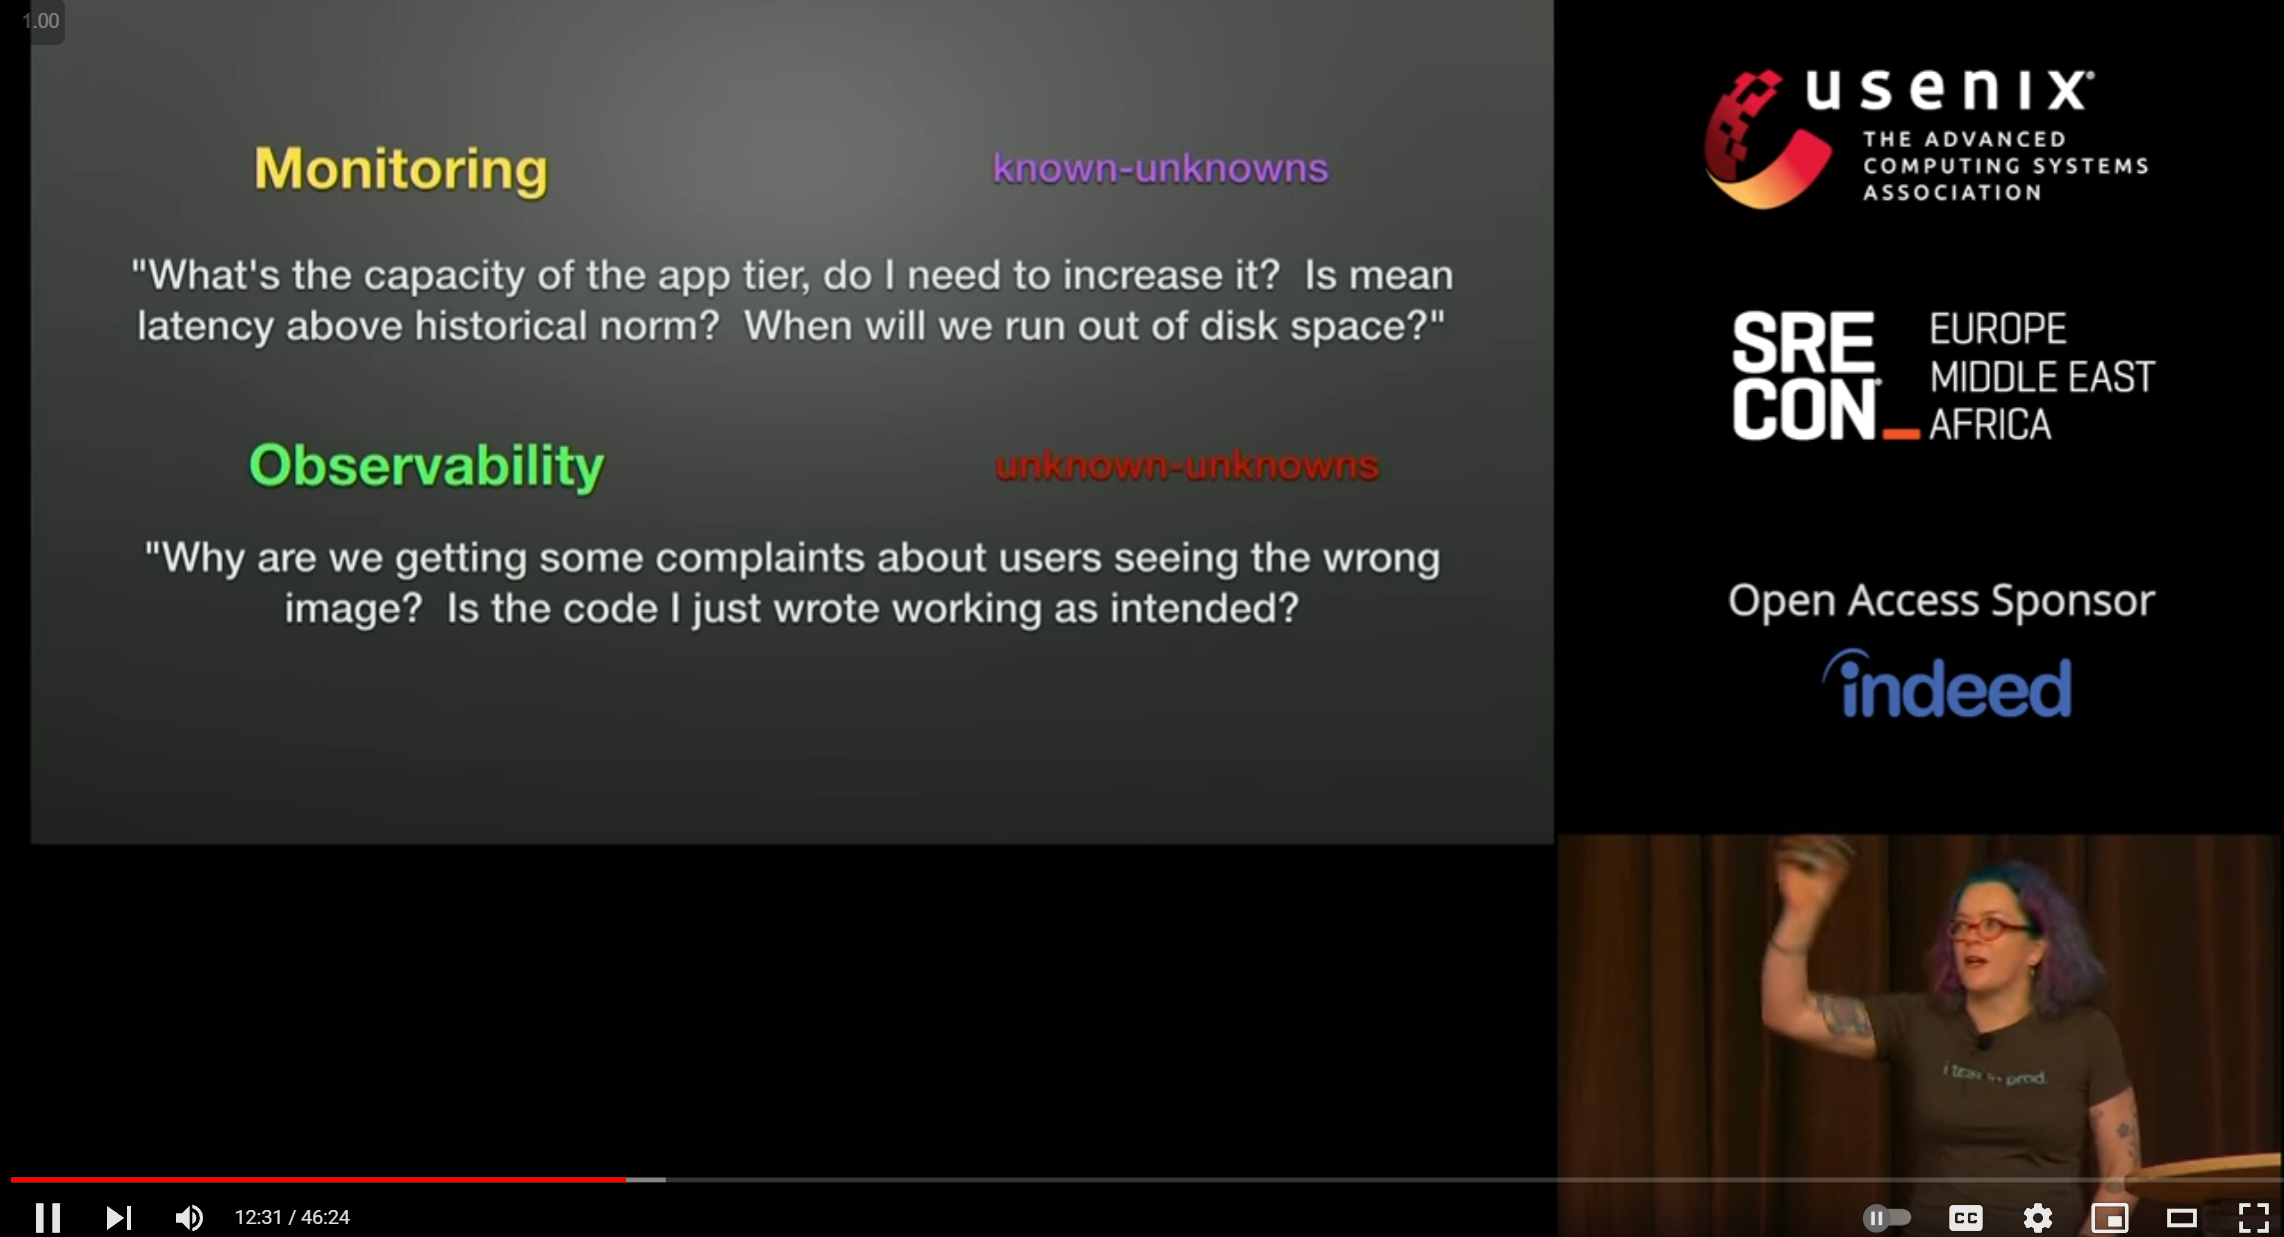
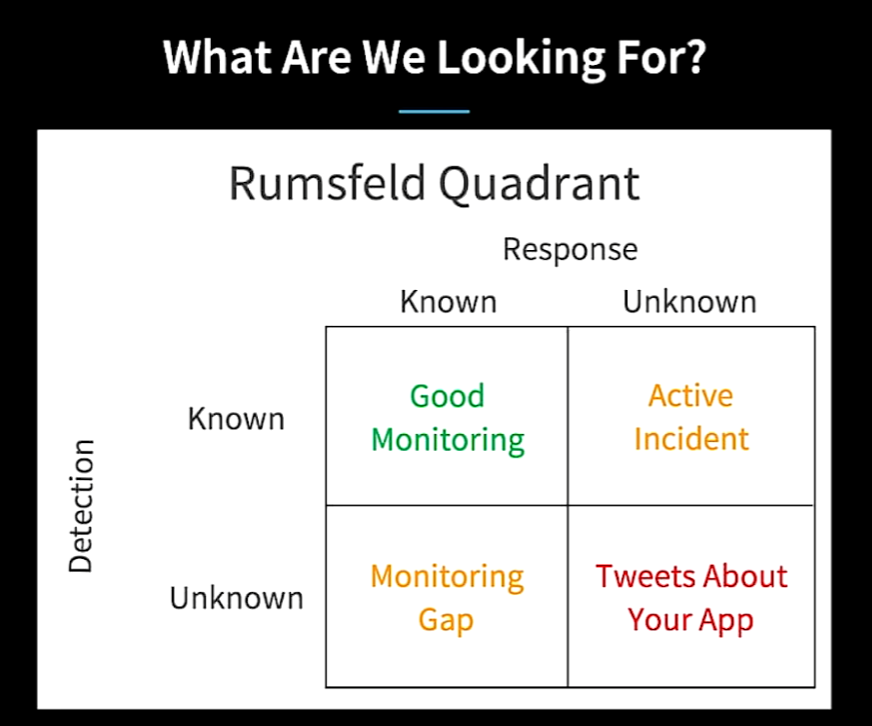
- Monitoring
- known-unknowns
- What’s the capacity of the app tier, do I need to increase it?
- Is mean latency above historical norm?
- When will we run out of disk space?
- known-unknowns
- Observability
- unknown-unknowns
- Why are we getting some complaints about users seeing the wrong image?
- Is the code I just wrote working as intended?
- unknown-unknowns
Extra
https://newrelic.com/blog/best-practices/what-is-observability
Kubicast
https://www.getup.io/kubicast
instana
- Fernando:
- Big Data in Practice: How 45 Successful Companies Used Big Data Analytics to Deliver Extraordinary Results (Livro do Bernard Marr)
- Live-action da Mulan (Disney+)
- João:
- A Arte da Autodefesa (Netflix)
elastic
- quais logs eu vou ler?
- todos falam com todos onde está o erro?
-
garantir o SLA. MTTR
- instrumentacao whitebox vs blackbox
- instrumentacao blackbox regras pre estabelecidas
- agente magico attache no processo e faça o profiling e retire as informações que precise
- tentar extrair o maximo que pode sem ser instrusivo o sufficiente para nao onerar a performance do codigo
- java: tudo exposto via jmx
- regras pre-estabelecidades. tudo o que for default.
- agente magico attache no processo e faça o profiling e retire as informações que precise
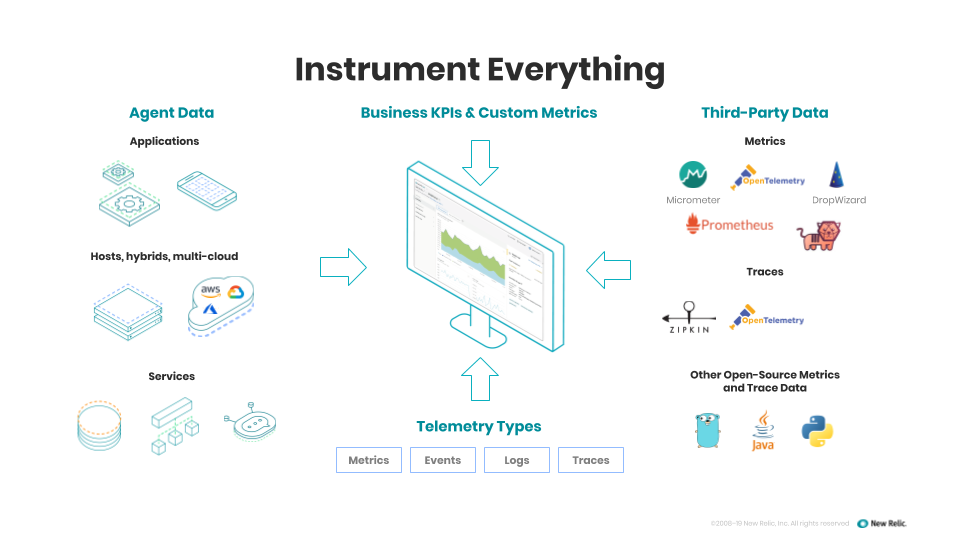
new relic
- monitoramento
- o que?
- quando?
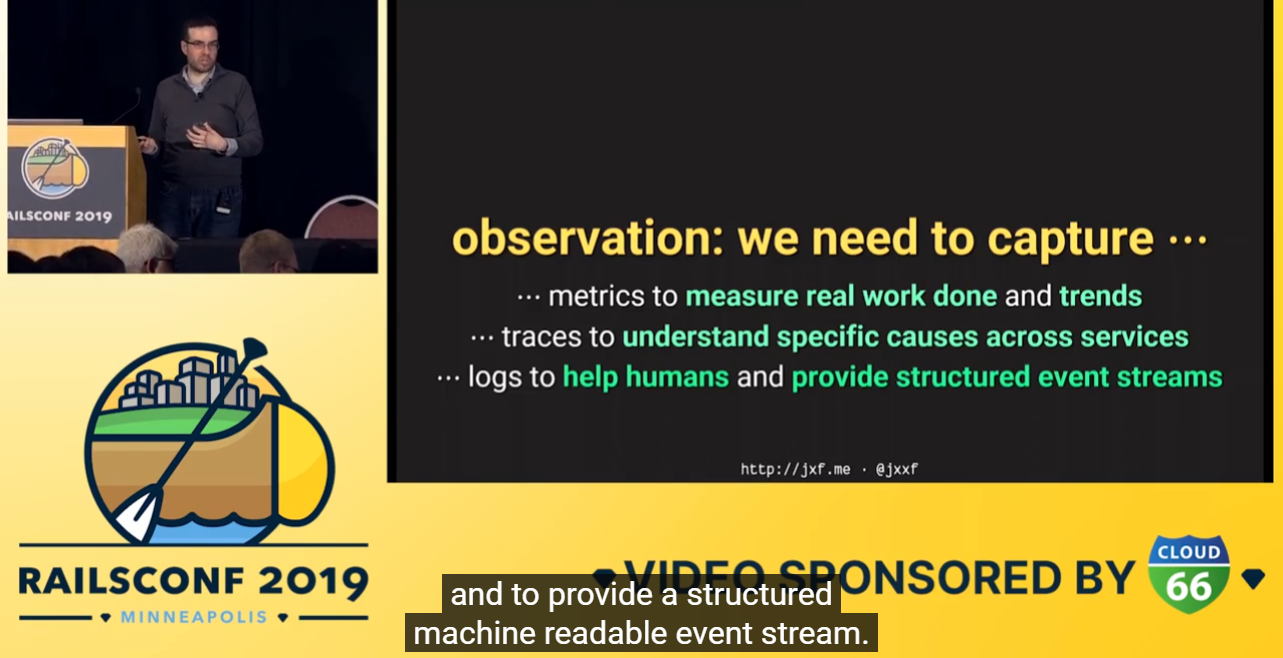
- observability
- por que?
- como?
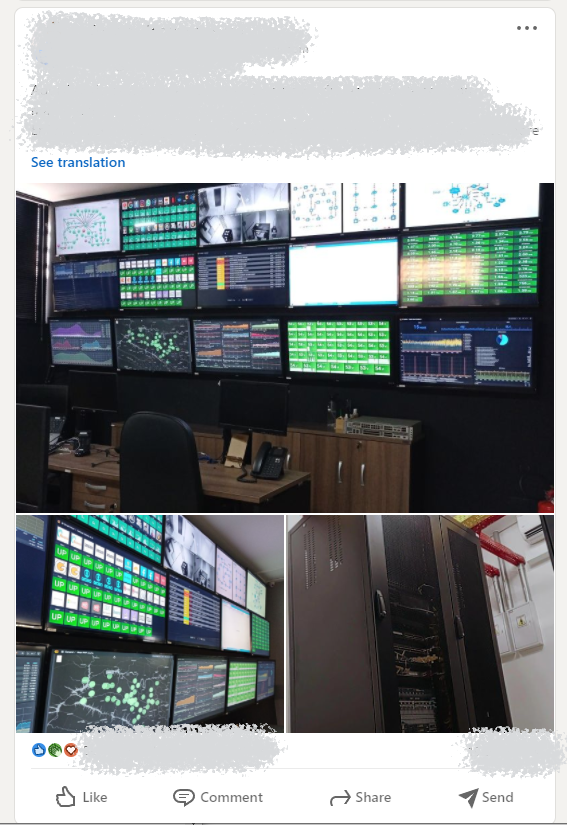
flowcharting awesome
https://www.linkedin.com/posts/raphaelisp_dashboard-para-monitoramento-pops-atendidos-activity-6914692173141524480-zEvK?utm_source=linkedin_share&utm_medium=member_desktop_web
Observability Concepts you should know
https://blog.devgenius.io/observability-concepts-you-should-know-943fc057b208
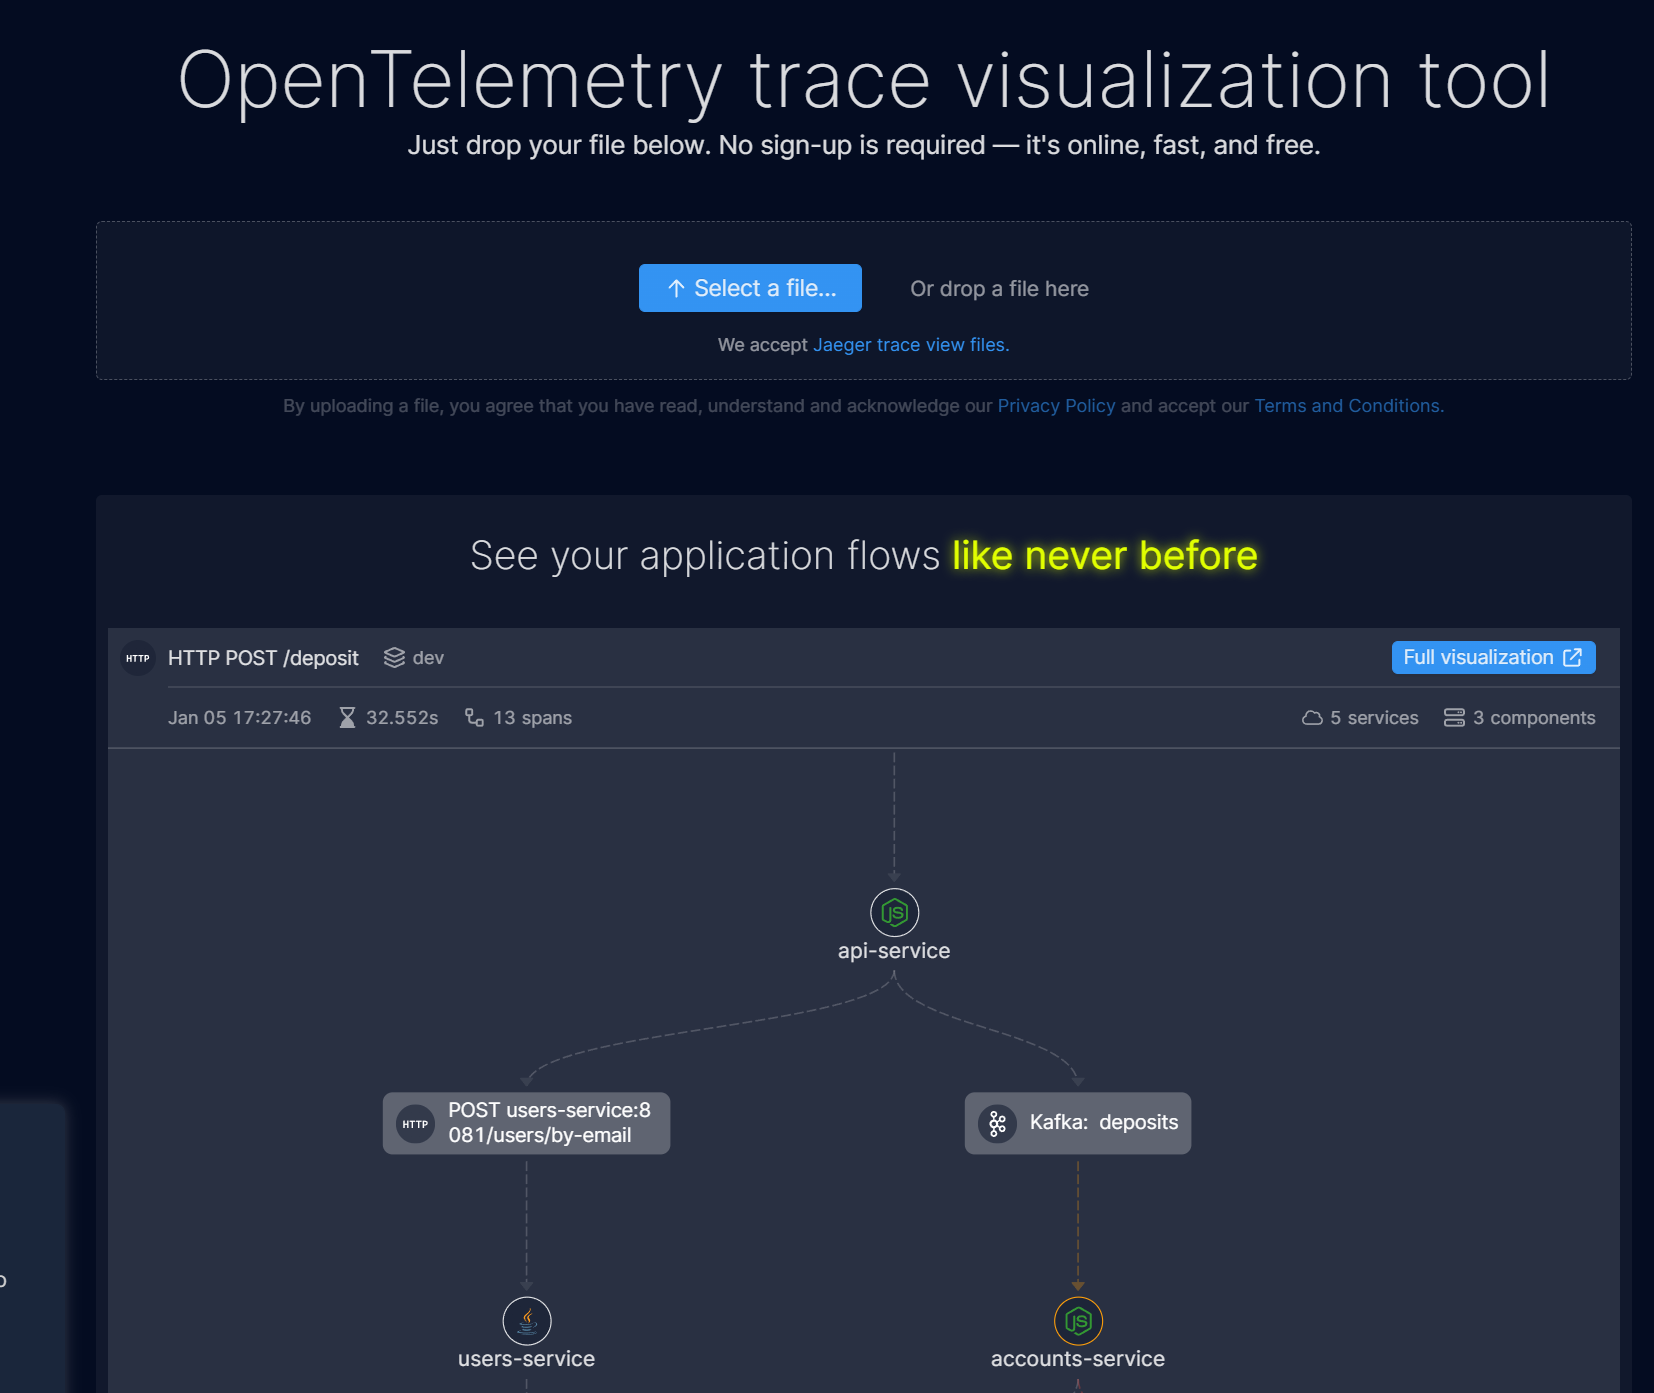
Helios
https://app.gethelios.dev/trace-vis
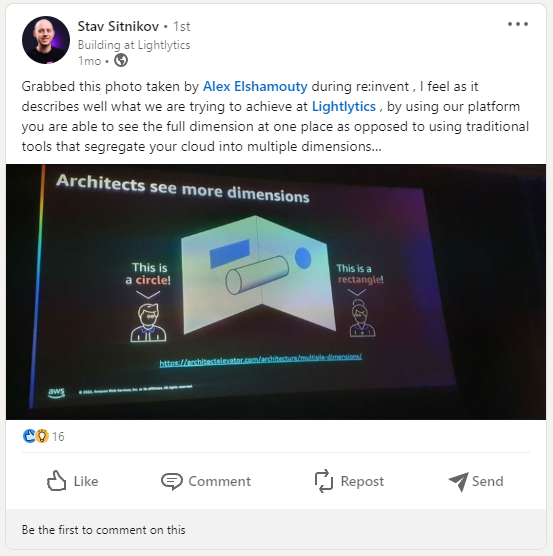
Lightlitcs
https://www.linkedin.com/posts/stavsitnikov_grabbed-this-photo-taken-by-alex-elshamouty-activity-7004844830900023296-Uacc?utm_source=share&utm_medium=member_desktop