pip install pymysql sqlalchemy sqlalchemy_schemadisplay
#!python
from sqlalchemy import MetaData
from sqlalchemy_schemadisplay import create_schema_graph
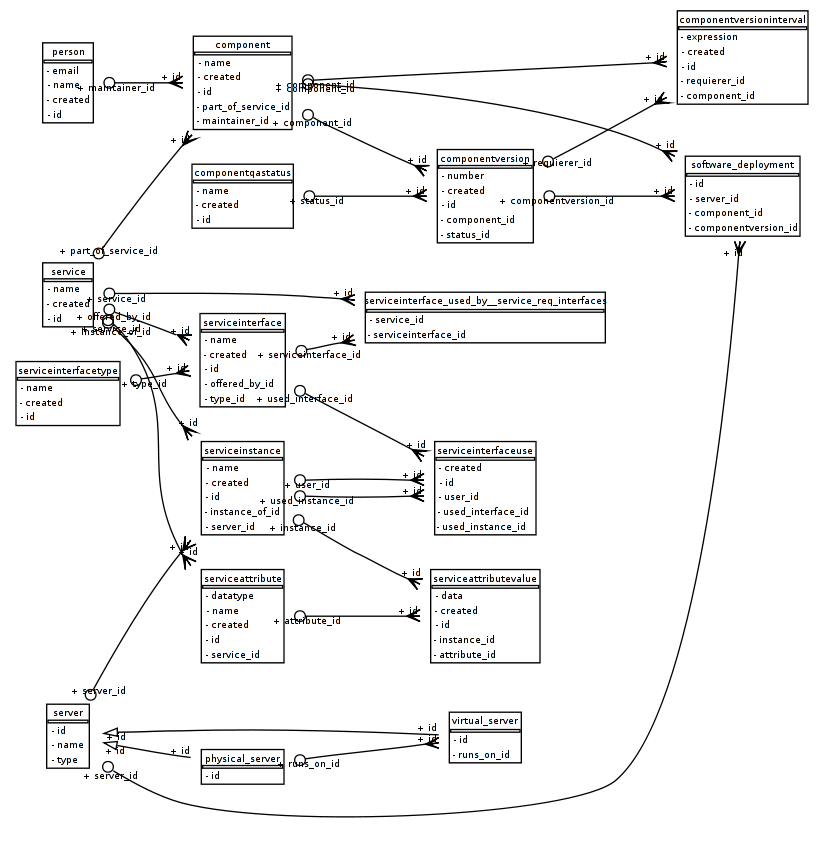
# create the pydot graph object by autoloading all tables via a bound metadata object
graph = create_schema_graph(metadata=MetaData('postgres://user:pwd@host/database'),
show_datatypes=False, # The image would get nasty big if we'd show the datatypes
show_indexes=False, # ditto for indexes
rankdir='LR', # From left to right (instead of top to bottom)
concentrate=False # Don't try to join the relation lines together
)
graph.write_png('dbschema.png') # write out the file
from myapp import model
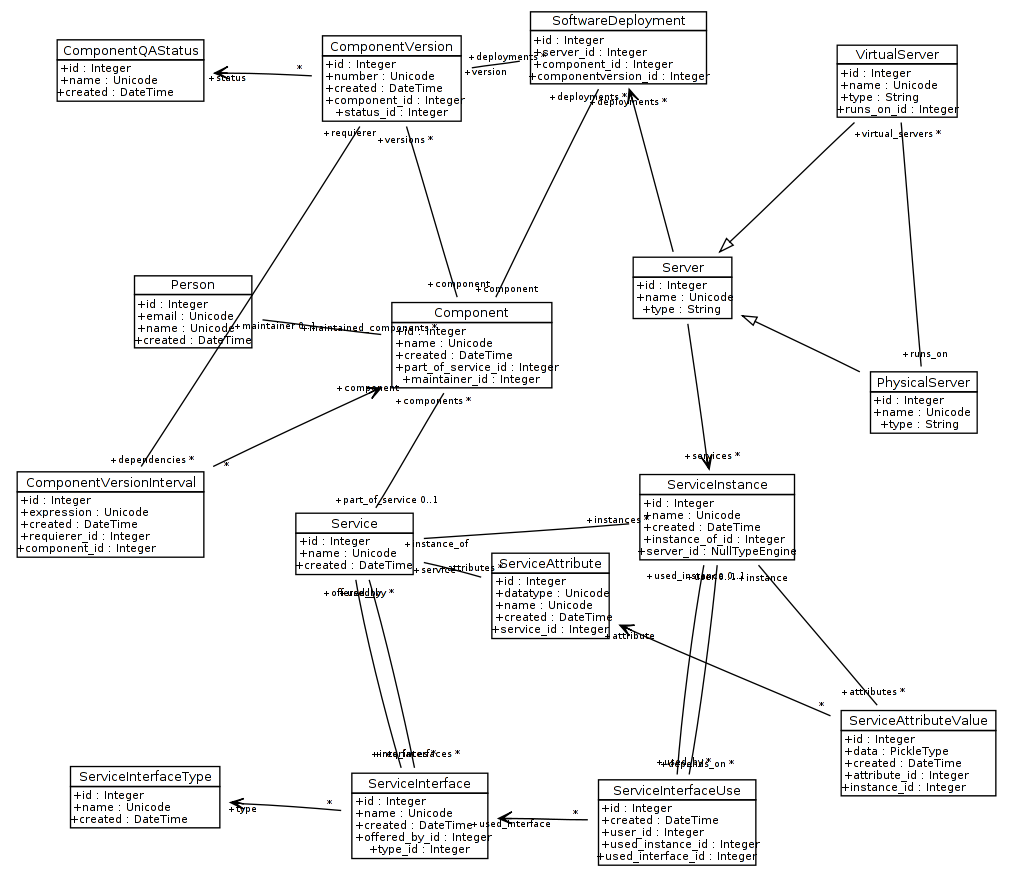
from sqlalchemy_schemadisplay import create_uml_graph
from sqlalchemy.orm import class_mapper
# lets find all the mappers in our model
mappers = []
for attr in dir(model):
if attr[0] == '_': continue
try:
cls = getattr(model, attr)
mappers.append(class_mapper(cls))
except:
pass
# pass them to the function and set some formatting options
graph = create_uml_graph(mappers,
show_operations=False, # not necessary in this case
show_multiplicity_one=False # some people like to see the ones, some don't
)
graph.write_png('schema.png') # write out the file
https://stackoverflow.com/questions/44981986/sqlalchemy-er-diagram-in-python-3/46020917 https://github.com/sqlalchemy/sqlalchemy/wiki/SchemaDisplay