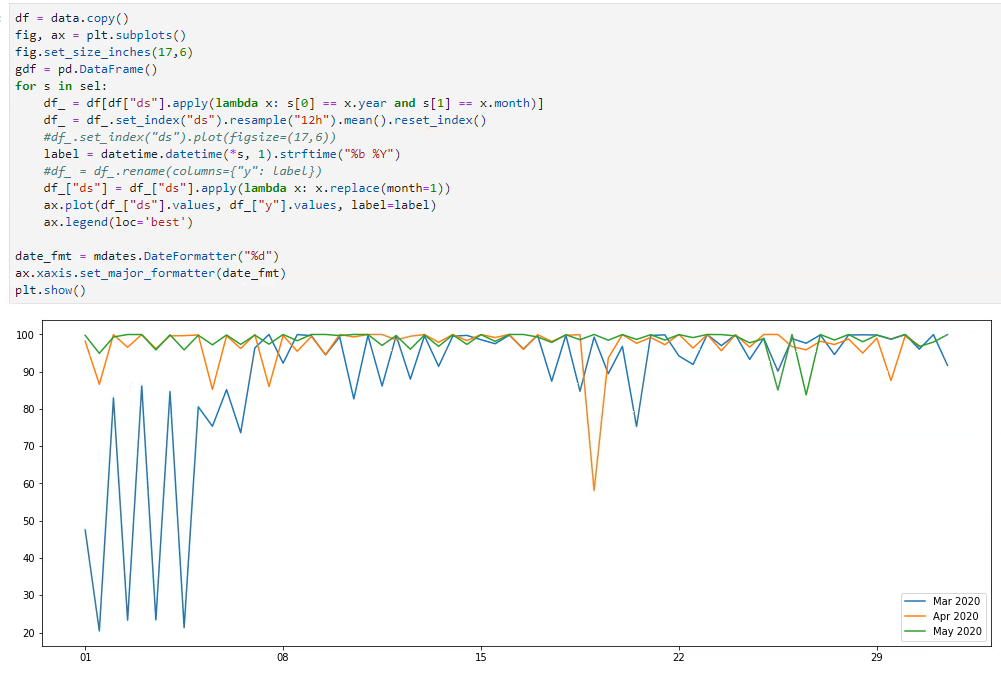
Matplotlib date format xaxis
https://stackoverflow.com/questions/33743394/matplotlib-dateformatter-for-axis-label-not-working
import numpy as np   # v 1.19.2
import pandas as pd  # v 1.1.3

# Create sample time series with month start frequency, plot it with a pandas bar chart
rng = np.random.default_rng(seed=1) # random number generator
dti = pd.date_range('1/1/2014', periods=20, freq='m')
df = pd.DataFrame(data=rng.normal(size=dti.size), index=dti)
ax = df.plot.bar(figsize=(10,4), legend=None)

# Set major ticks and tick labels
ax.set_xticks(range(df.index.size))
ax.set_xticklabels([ts.strftime('%b\n%Y') if ts.year != df.index[idx-1].year
                    else ts.strftime('%b') for idx, ts in enumerate(df.index)])
ax.figure.autofmt_xdate(rotation=0, ha='center');
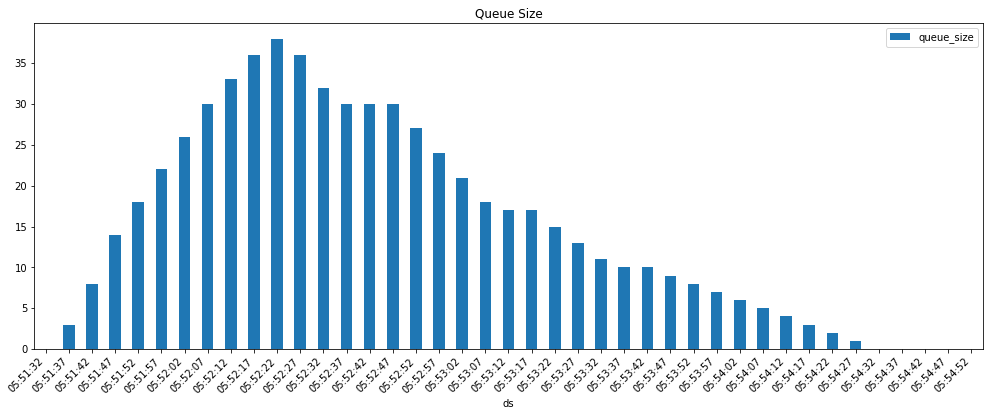
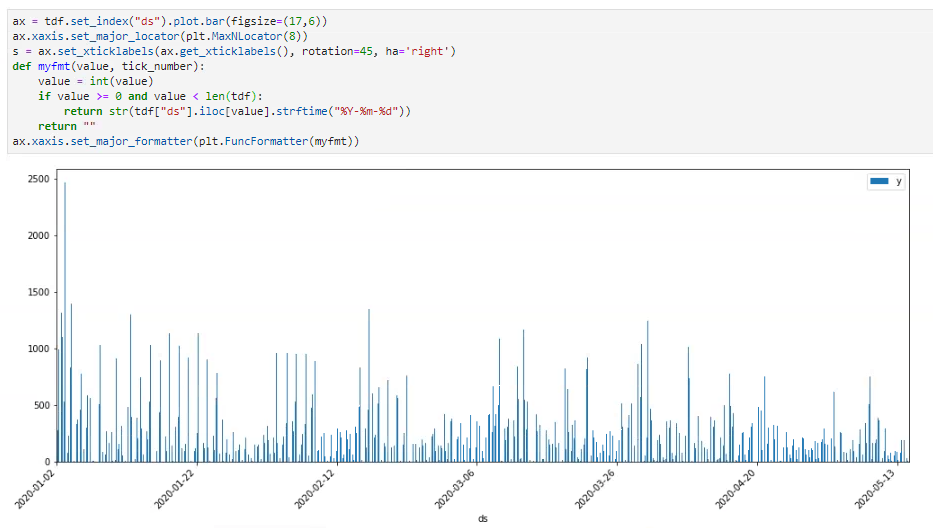
ax = df[['ds', 'queue_size']].set_index('ds').plot(figsize=(17,6), kind='bar')
ax.set_title('Queue Size')
ax.set_xticks(range(df.ds.size))
aa = ax.set_xticklabels([ts.strftime('%H:%M:%S')for idx, ts in enumerate(df.ds)])
aa = ax.set_xticklabels(ax.get_xticklabels(), rotation=45, horizontalalignment='right')
Force tz convertion
tdf["ds"] = tdf["ds"].dt.tz_convert('America/Sao_Paulo')
tdf["ds"] = pd.to_datetime(tdf["ds"].apply(lambda x: (x + x.utcoffset()).timestamp()), unit='s', utc=True)
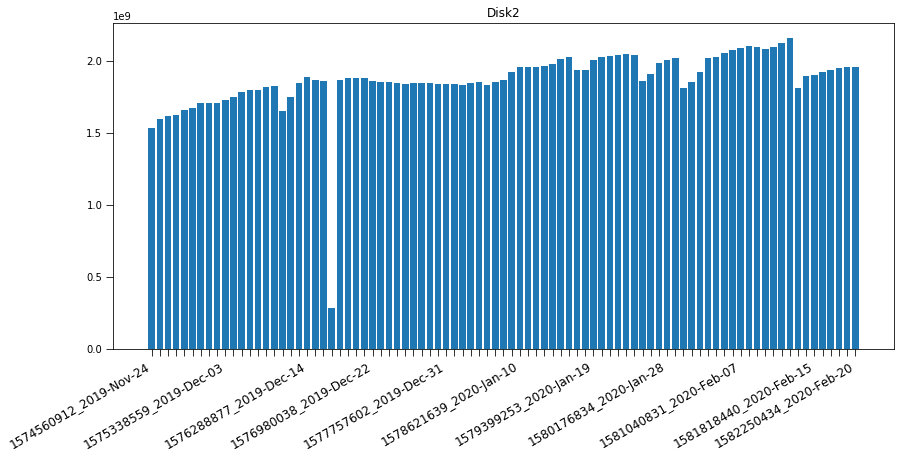
Bar plot axis diagonal label
import matplotlib.pyplot as plt
%matplotlib inline

tdf = tdf.sort_values("date")
display(tdf.head())
#tdf.sort_values("date").set_index("date").tail(15).plot(kind='bar',figsize=(22,6),rot=45)
fig, ax = plt.subplots()
fig.set_size_inches(14,6)
def parse(x):
    a,b = x.split("_")
    return "{}_{}".format(b, toil.getsptime(b).strftime("%Y-%b-%d"))
bkids2 = [i.split("_")[1] for i in bkids]
lastk = 0
customticks = []
x = list(tdf["backupid"].apply(parse))
for k,tick in enumerate(x):
    l,r = tick.split("_")
    if l in bkids2:
        lastk = k
        customticks.append(tick)
    elif k == 0:
        customticks.append(tick)
    elif k == len(x)-1:
        customticks.append(tick)
    elif k%9==0 and abs(k-lastk) > 6:
        if "2485" in tick:
            customticks.append("")
        else:
            customticks.append(tick)
    else:
        customticks.append("")

print(x)
ax.bar(x, list(tdf["disksize (KB)"].values))
ax.set_xticklabels(customticks)
#ax.tick_params(which='both', width=2)
ax.tick_params(which='major', length=7)
ax.tick_params(axis="x", labelsize=12)
ax.set_title("Disk2")
for label in ax.get_xmajorticklabels() + ax.get_xmajorticklabels():
    label.set_rotation(30)
    label.set_horizontalalignment("right")
Pandas Bar plot axis diagonal label
chart = a["METRIC_DATA"].iloc[0].set_index("ds").plot(kind='bar', figsize=(18,5))
chart.set_xticklabels(chart.get_xticklabels(), rotation=45, horizontalalignment='right')
plt.show()
plt.pause(0.001)

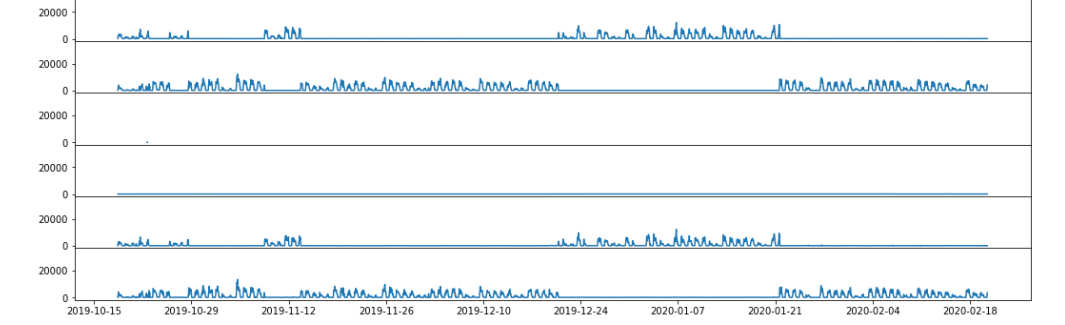
Sparkline print
size = len(ck)
#size = 10
fig, ax = plt.subplots(size, sharex=True, sharey=True, gridspec_kw={'hspace': 0})
fig.set_size_inches(18,size)
for index in range(size):
    i = ck[index]
    if not i in appd_bt_calls: continue
    _tdf = appd_bt_calls[i]
    _tdf["ds"] = _tdf["ds"].dt.tz_localize(None)
    if fit is not None:
        rows = _tdf.to_dict(orient='records')
        for k,v in b.iteritems():
            rows.append({"ds": v, "y": np.nan})
    ax[index].plot(_tdf["ds"].values, _tdf["y"].values, label=i)
    ax[index].legend(loc='upper right', bbox_to_anchor=(1.35, 1))
plt.show()
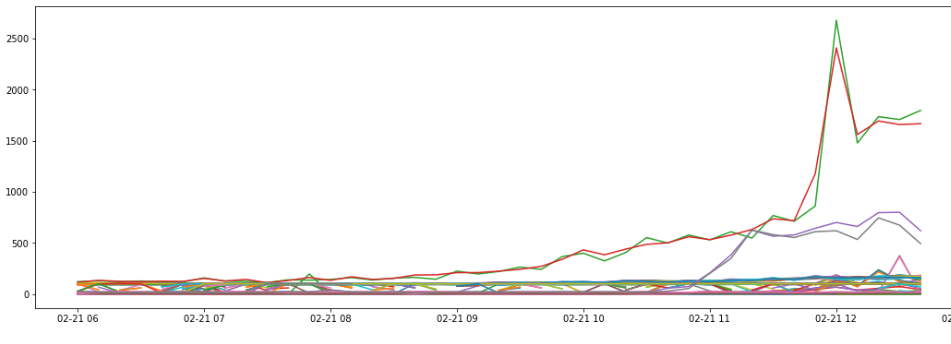
Line Plot Many
def plotcalls(pod_names, fit=None):
    fig, ax = plt.subplots()
    fig.set_size_inches(18,6)
    for i in pod_names:
        if not i in appd_bt_calls: continue
        _tdf = appd_bt_calls[i]
        if fit is not None:
            rows = _tdf.to_dict(orient='records')
            for k,v in b.iteritems():
                rows.append({"ds": v, "y": None})
            _tdf = pd.DataFrame(rows)
            _tdf = _tdf.drop_duplicates()
            _tdf["ds"] = pd.to_datetime(_tdf["ds"].apply(lambda x: x.timestamp()), unit='s', utc=True)
            _tdf = _tdf.sort_values("ds").reset_index(drop=True)
            _tdf["y"] = _tdf["y"].interpolate()
            _tdf = _tdf[_tdf["ds"].isin(fit.values)].reset_index(drop=True)
            _tdf = _tdf.replace(float('nan'), 0)

        ax.plot(_tdf["ds"].values, _tdf["y"].values, label=i)
    ax.legend(loc='upper right', bbox_to_anchor=(1.4, 1))
    plt.show()
plotcalls(ck[:10])
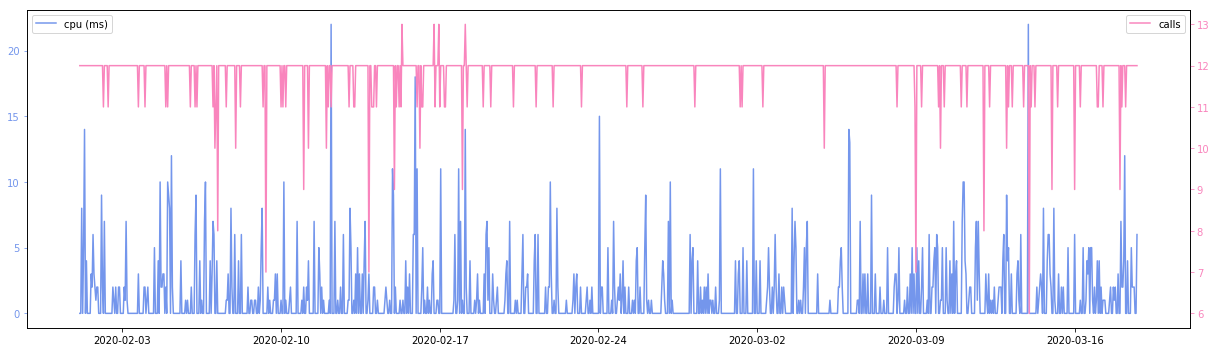
Dual axis plot
import matplotlib.pyplot as plt

def savefig(gdf, save_fig_path=""):
    fig, ax = plt.subplots()
    fig.set_size_inches(17,5)
    l = "#7496ec"
    r = "#f985bd"
    ax.plot(gdf["ds"].values, gdf["cpu"].values, color=l, label="cpu (ms)")
    ax2 = ax.twinx()
    ax2.plot(gdf["ds"].values, gdf["calls"].values, color=r, label='calls')
    ax.legend(loc=2)
    ax2.legend(loc=0)
    ax.tick_params(axis='y', colors=l)
    ax2.tick_params(axis='y', colors=r)
    fig.tight_layout()
    if save_fig_path == "":
        fig.savefig(save_fig_path)
    else:
        plt.show()
savefig(gdf)
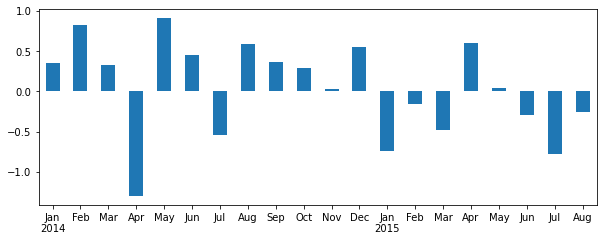
Bar plot from pandas
Compare month’s days