https://stackoverflow.com/questions/11067368/annotate-time-series-plot-in-matplotlib
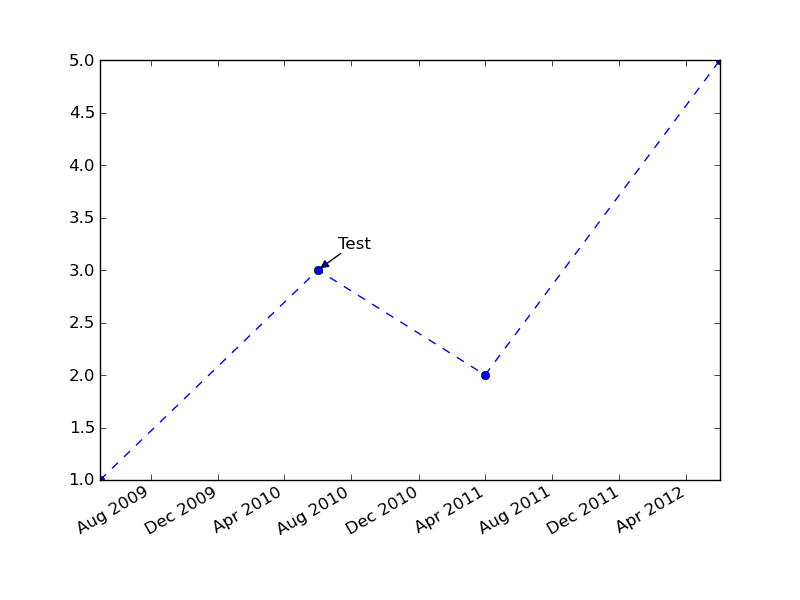
import datetime as dt
import matplotlib.pyplot as plt
import matplotlib.dates as mdates

x = [dt.datetime(2009, 05, 01), dt.datetime(2010, 06, 01),
     dt.datetime(2011, 04, 01), dt.datetime(2012, 06, 01)]
y = [1, 3, 2, 5]

fig, ax = plt.subplots()
ax.plot_date(x, y, linestyle='--')

ax.annotate('Test', (mdates.date2num(x[1]), y[1]), xytext=(15, 15),
            textcoords='offset points', arrowprops=dict(arrowstyle='-|>'))

fig.autofmt_xdate()
plt.show()
enter image description here
https://stackoverflow.com/questions/19073683/matplotlib-overlapping-annotations-text
pip install adjustText
https://github.com/Phlya/adjustText
import matplotlib.pyplot as plt
from adjustText import adjust_text
import numpy as np
together = [(0, 1.0, 0.4), (25, 1.0127692669427917, 0.41), (50, 1.016404709797609, 0.41), (75, 1.1043426359673716, 0.42), (100, 1.1610446924342996, 0.44), (125, 1.1685687930691457, 0.43), (150, 1.3486407784550272, 0.45), (250, 1.4013999168008104, 0.45)]
together.sort()

text = [x for (x,y,z) in together]
eucs = [y for (x,y,z) in together]
covers = [z for (x,y,z) in together]

p1 = plt.plot(eucs,covers,color="black", alpha=0.5)
texts = []
for x, y, s in zip(eucs, covers, text):
    texts.append(plt.text(x, y, s))

plt.xlabel("Proportional Euclidean Distance")
plt.ylabel("Percentage Timewindows Attended")
plt.title("Test plot")
adjust_text(texts, only_move='y', arrowprops=dict(arrowstyle="->", color='r', lw=0.5))
plt.show()

df = pd.DataFrame(row)
df.columns = ['ds', 'language', 'exp']
df = df.sort_values('ds')
fig, ax = plt.subplots()
fig.set_size_inches(17,6)
texts = []
for language in set(df['language'].values):
    df_ = df[df['language'] == language]
    #print(language, df_['exp'].values)
    if len(set(df_['exp'].values)) == 1: continue
    ax.plot(df_['ds'].values, df_['exp'].values, label=language)
    ax.scatter(df_['ds'].values, df_['exp'].values)
    #ax.text(df_['ds'].values, df_['exp'].values+0.3, [str(_) for _ df_['exp'].values])
    for v in [-2,-1]:
        x = df_['ds'].values[v]
        y = df_['exp'].values[v]
        texts.append(plt.text(x,y,y))
        continue
        ax.annotate(y,
                    (x, y),
                    textcoords='offset points',
                    xycoords='figure points',
                    xytext=(0,20),
                    ha='center',
                    arrowprops=dict({'arrowstyle': '-|>'})
                   )
ax.set_ylim([0, 6500])
ax.legend(loc='best')
adjust_text(texts, only_move={'a': 'y'}, arrowprops=dict(arrowstyle="->", color='r', lw=0.5))
plt.show()
