Leveraging Appdynamic’s flow map through intuitive engineering
 vizceral’s flow map
Recently I watched Josh Evans talk on Youtube (yeah pretty late but never too late) and found out among many other interesting topics his use of this amazing visualization opensource Netflix tool called Vizceral which got me eager to try it out. It has a good wiki to get started here and a all setup example here. The json template is pretty straighforward and carefully explained so that you can easily port any topology you already have. Similar to D3js nodes and links structure but Vizceral uses ThreeJs (Webgl) with nodes and connections hierarchy structure where each node can have other nodes and connections inside it. The block below was taken from here.
{

  renderer: 'global',
  name: 'edge',
  maxVolume: 100000,
  entryNode: 'INTERNET',
  // list of nodes for this graph
  nodes: [
    {
      renderer: 'region',
      layout: 'ltrTree',
      name: 'us-west-2',
      updated: 1462471847,
      maxVolume: 100000,
      nodes: [],
      connections: []
    }
  ]
}
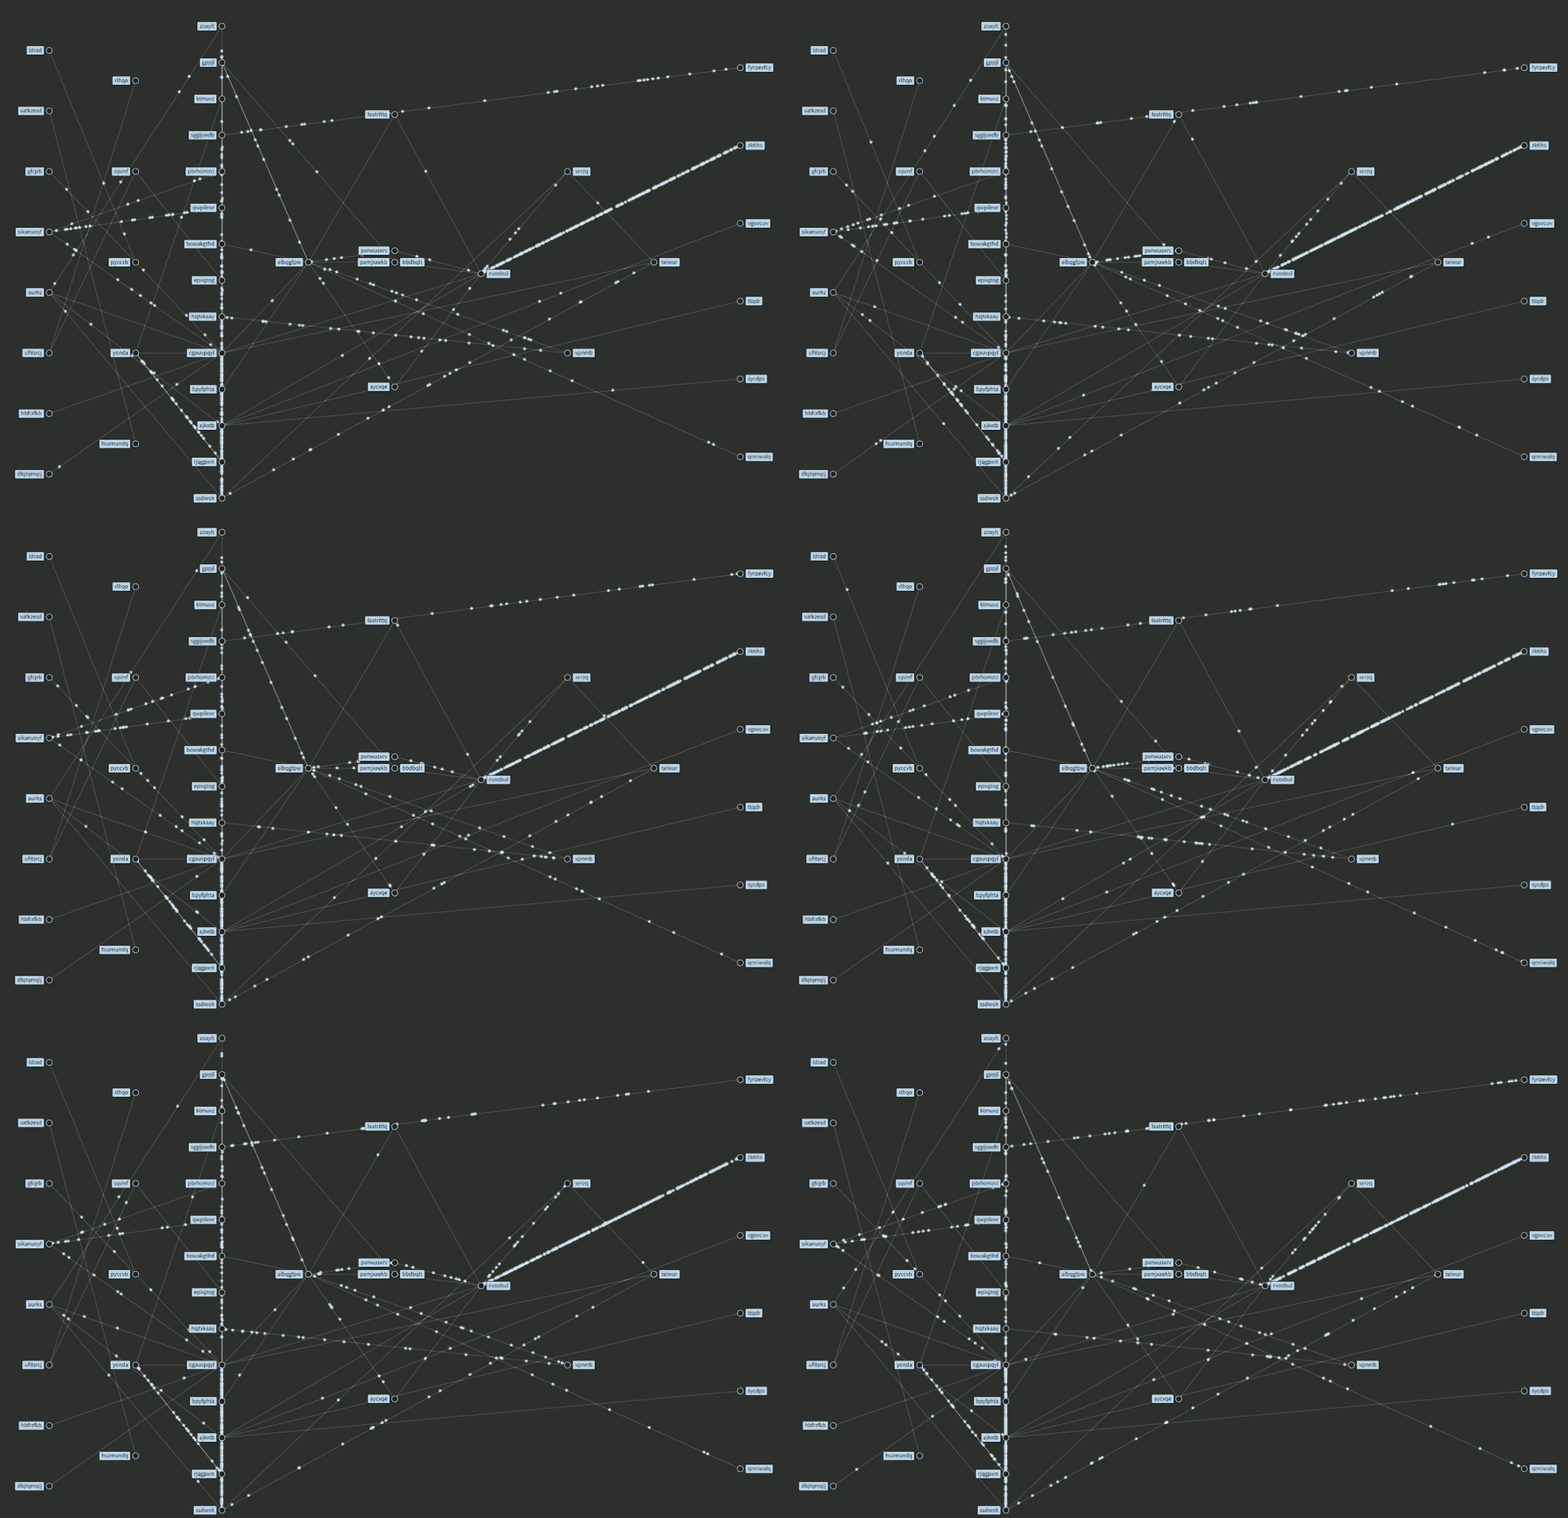
So my architecture was like this: 
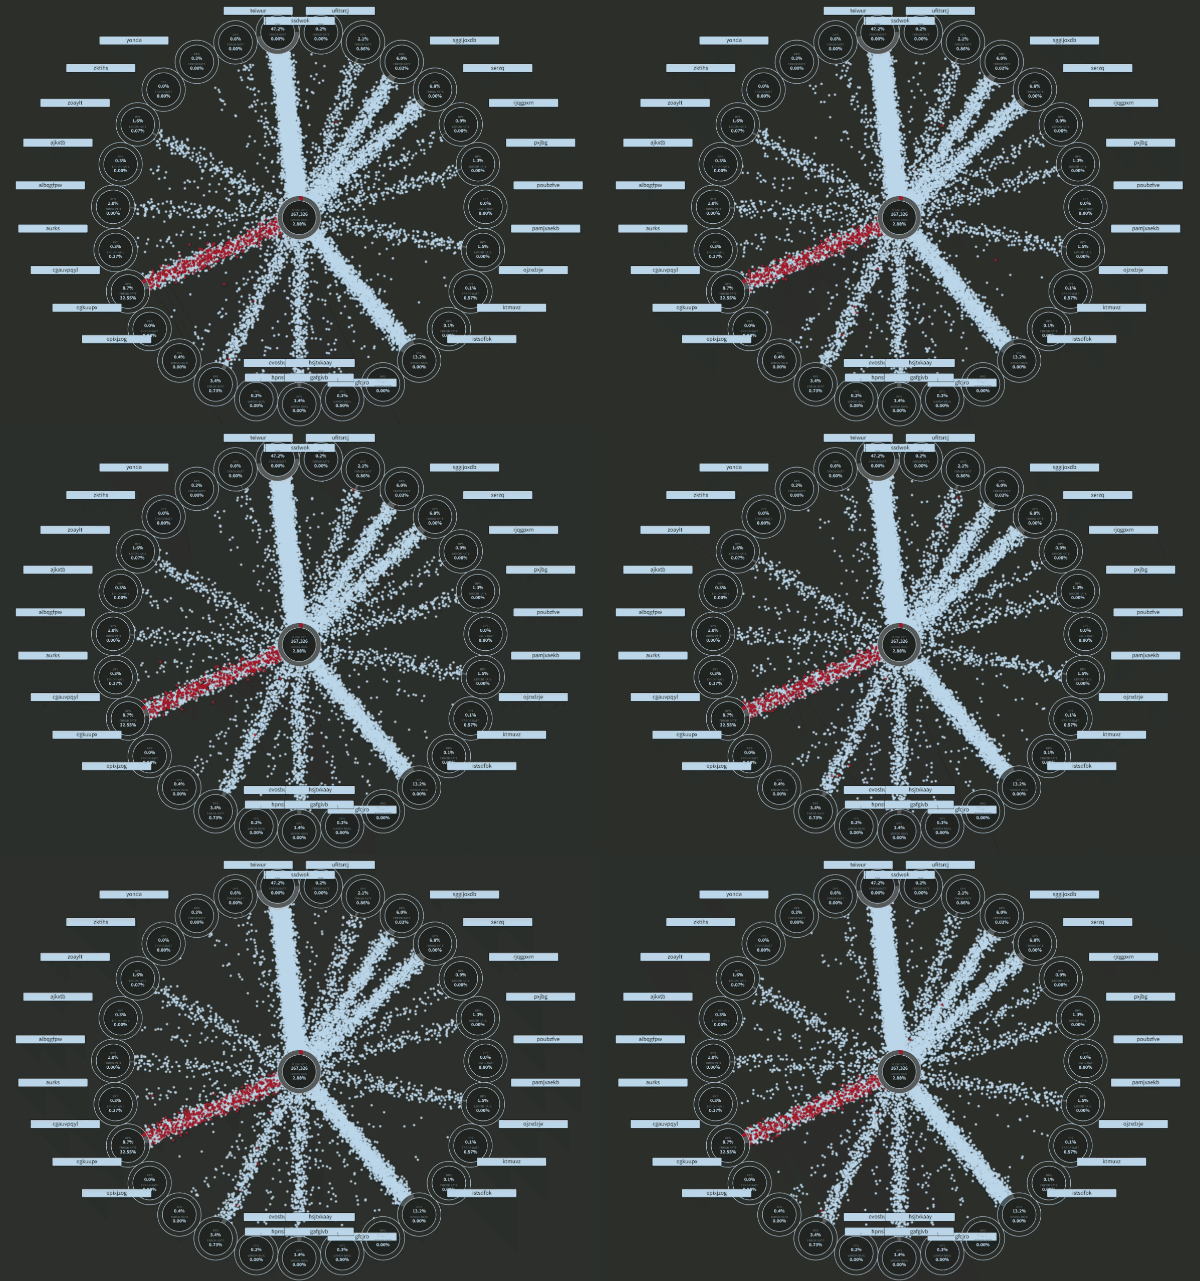
And the results were astouding as expected:


Where you can easily spot pressure points in your microservices infrastruture as well as slow response calls and errors. And we can also add it to your Grafana dashboard as shown here.

[
That’s all! Some useful resources:
- https://github.com/adrianco/go-vizceral
- https://github.com/nmnellis/vistio
- https://github.com/nghialv/promviz
[

