An exploratory analysis..
 Source: https://www.codeclubworld.org/
For the past two weeks I just got really into this coding challenge website introduced to me by Joma Tech’s youtube video.
In there one can find many coding problems divided into different categories (Algorithms, databases, bash, parallel) that’s also been used by interviewers from the big tech companies which you can see on the image below:
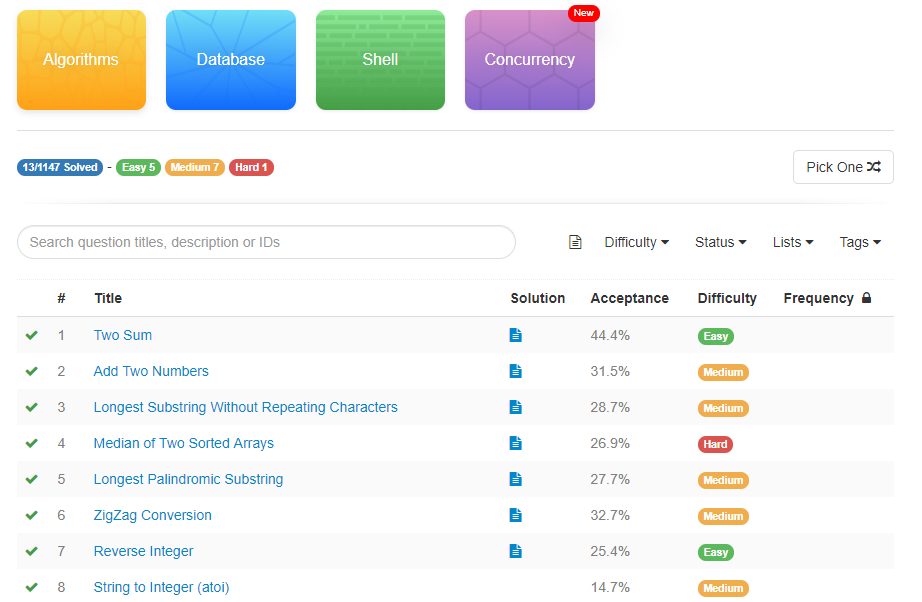 Leetcode’s problemset front page
They also have a weekly contest in which the participants have 1:30h to solve 4 really challenging questions. Well not so challenging questions as the top players finish all four of them in about 30minutes of competition. Which let me thinking.. Who are they? Where are they at? Which Companies? Colleges? Countries?
So this post is to let you through my journey to get the answers to those questions.
Let’s begin!
So I used Selenium to gather the information needed (Location, School and Company) from all the users from the Global Ranking right after the Weekly Contest #147 finished and used Python, Matplotlib and Seaborn to plot my data.
My findings are as follows. Also all the code as well as the dataset can be found in my github repo here.
So I’ve gathered data from 49975 users.
users.info()
<class 'pandas.core.frame.DataFrame'>
RangeIndex: 49975 entries, 0 to 49974
Data columns (total 4 columns):
Company     49975 non-null object
Location    49975 non-null object
School      49975 non-null object
name        49975 non-null object
dtypes: object(4)
memory usage: 1.5+ MB
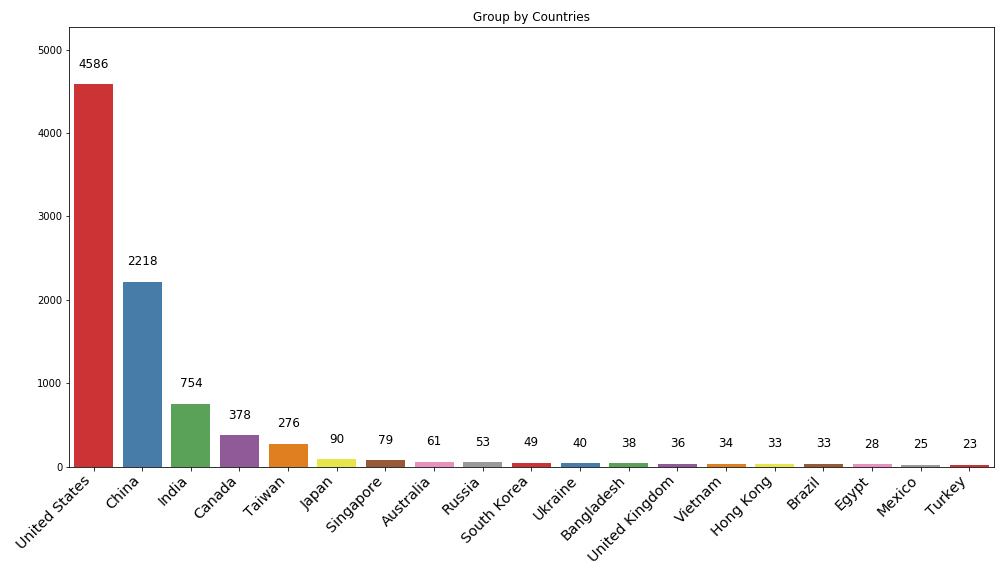
The majority of players are from the US followed by China.
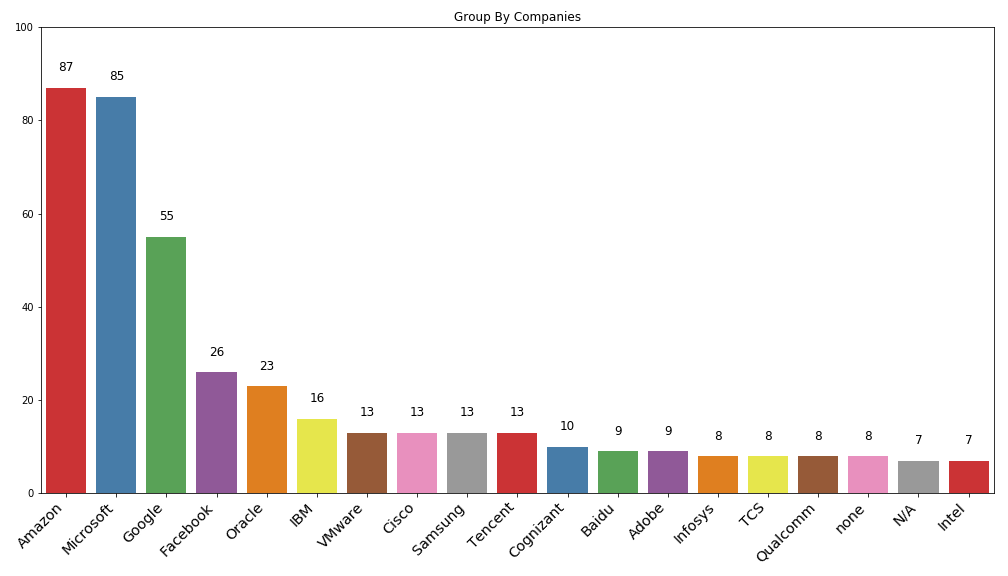
Amazon employees are leading the rank by a few players:
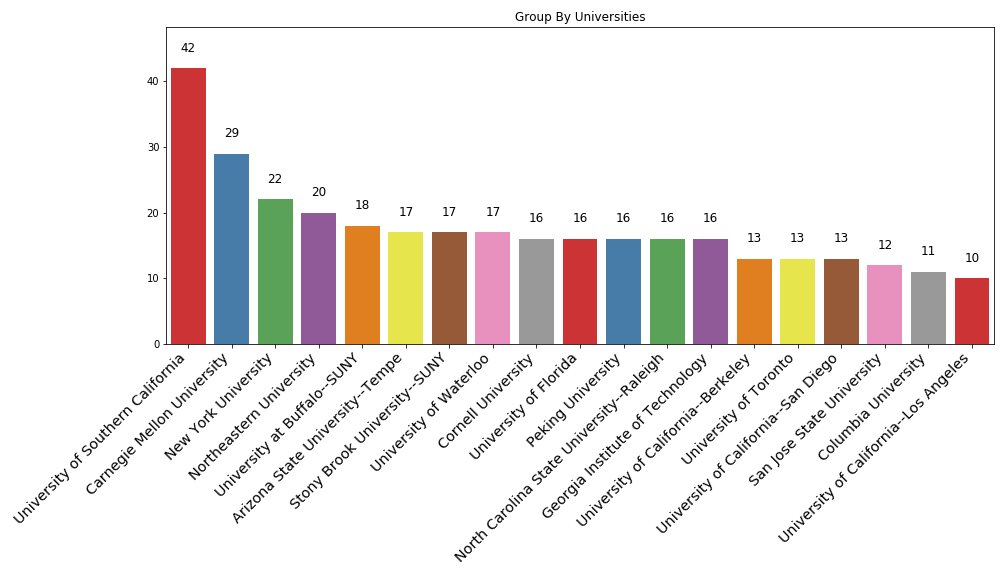
Also most players from US universities appear on the rank and only one from china (Peking University) amongst them.
Some caveats: There’s also a need to enhance the data cleansing as some users inputs different names for the same Company like “Thomson Reuters”, “Samsung R&D” and “Cisco Systems” shown below:
users.loc[users["Company"].str.contains('ms', flags=re.IGNORECASE, regex=True)].Company.unique()
array(['Epic Systems', 'Nit Jamshepur', 'Caplin Systems Ltd',
       'Samsung R&D', 'Samsung', 'Samsung R&D Bangalore', 'MSFT',
       'Epic Systems Corp', 'Samsung R&D Institute India - Bangalore',
       'Clemson University', 'Ms', 'samsung', 'C Squared Systems LLC',
       'CURRENTLY INTERN AT SAMSUNG RESEARCH INSTITUTE,NOIDA',
       'Thomsonreuters', 'Adobe Systems India Pvt Ltd.',
       'Thomson Reuters', 'Hughes Network Systems', 'SAMSUNG',
       'Samsung Research Institute', 'Vail Systems', 'Pocket Gems',
       'Gridco Systems', 'Radiant Vision Systems', 'cisco systems',
       'Cisco systems', 'Adobe systems', 'Factset Research Systems',
       'PegaSystems', 'EPAM Systems', 'Institute of the Software Systems',
       'cisco systesms', 'Bristol Farms', 'Adobe Systems',
       'Epam systems inc', 'Epic Systems Corporation',
       'Scalable Systems Research Labs', 'pegasystems', 'Cisco Systems',
       'Epam Systems', 'Cadence Design Systems',
       'Harris Communication Systems', 'Persistent Systems Limited',
       'Samsung;EPAM', 'Cisco Systems Inc.'], dtype=object)
That’s all thank you.
Some references:
- https://www.drawingfromdata.com/how-to-rotate-axis-labels-in-seaborn-and-matplotlib
- https://stackoverflow.com/questions/45946970/displaying-of-values-on-barchart
- https://stackoverflow.com/questions/26540035/rotate-label-text-in-seaborn-factorplot
- https://seaborn.pydata.org/tutorial/color_palettes.html